Monday, July 18, 2022

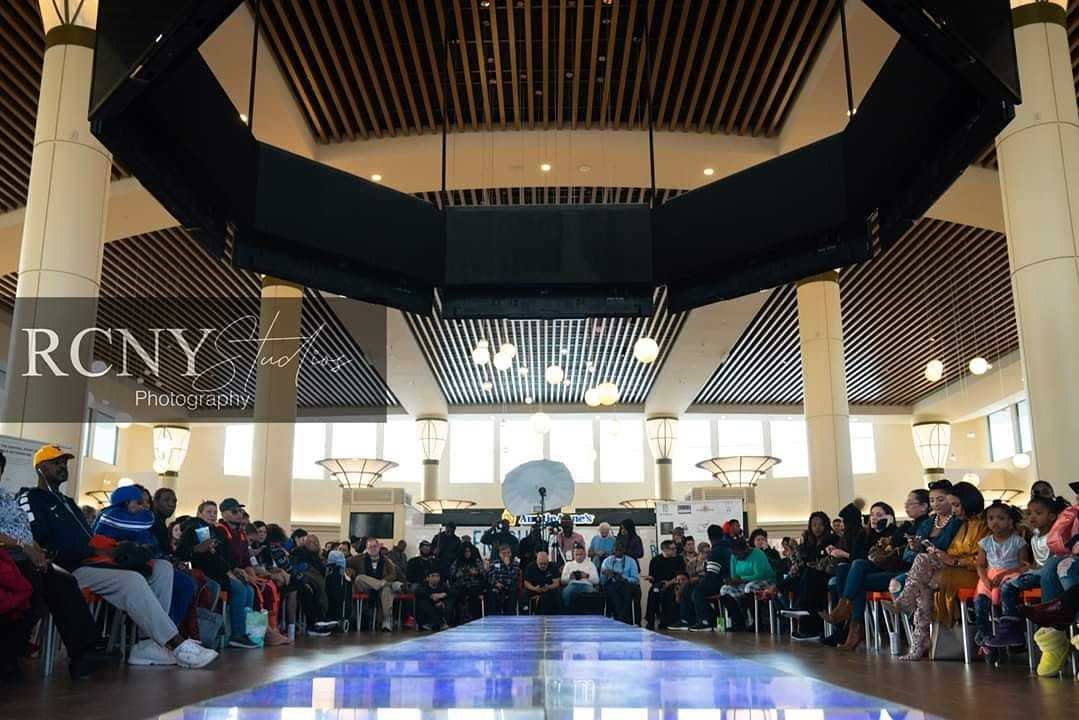
Bronx Fashion Week Fashion Designer & Model Casting


IMG 2175


Bronx Fashion Week Fashion Designer & Model Casting

Would you like to take your experience further? Have you always wanted to walk the runway? Do you want to break into the fashion industry, but need the skills to hit the scene like a Professional Fashion Designer? Develop your skills with Bronx Fashion Week! Build your business through out team of Fashion Network Professionals!

Between the Ages of 15 & Up, All Sizes, Models Please Wear All Black Attire, High Heels & Dress Shoes ONLY! NO Sneakers, Wedges or Open Toe Sandals will be ALLOWED! NO LATE ARRIVALS!

Upon Arrival Please Make Sure to Submit Comp Cards, Portfolio & Head Shots with Your Contact Information!

Bronx Fashion Week Casting: August 7, 2022

Times: 12:00pm to 2:00pm

Where: Mall at Bay Plaza, 200 Baychester Avenue, Third Floor (Food Court)

See you there

Bronx Fashion NYC 

FB IMG 1539289554477
90356236 10157933445592978 8852154465818509312 o
200229 EDALVAREZ 215A
DBD8C46F-1EF9-4371-AFC8-54E365CEA91F
89089303 10157900495667978 1281862311232929792 o

News, updates and more from NYC Council Member Rafael Salamanca, Jr.

NY1:15 new illegal dumping cameras to be installed in South Bronx


“Illegal dumping in the South Bronx and in my district has been an issue for decades,” Salamanca said.

Salamanca said the worst dumping takes place in the more industrial parts of his district, which includes Hunts Point and Point Morris. But mentioned that residential areas get hit too by what he referred to as bad actors.

“It’s unfortunate that some of these businesses prefer not to pay out of pocket and have their garbage thrown away by sanitation waste companies as is required by law,” Salamanca said.

Just streets away from where the news conference was held, there was clear evidence of illegal dumping, furniture and bags of miscellaneous trash items.

News12 The Bronx: DSNY, elected officials using surveillance to crack down on illegal dumping


“We have many bad actors,” said Salamanca. “Not just in this community, but that come from outside communities to come and illegally dump in our communities.”

The funds will cover personnel expenses to monitor and investigate these incidents. DSNY says summonses for illegal dumping have doubled since last year, with the number of impounded vehicles nearly tripling.

NY1 Noticias: Instalan cámaras en El Bronx para captar a quienes tiren basura ilegalmente -y multarlos


“Nosotros como neoyorquinos y aquí en el condado de El Bronx queremos nuestras calles limpias y desafortunadamente tenemos a muchas personas que no lea importa la calidad de nuestras vidas en nuestras comunidades", dijo Salamanca.

Un problema que afecta a los sectores comerciales e industriales, donde es común que tiren desechos de construcción, agregó el concejal. 

UNIVISION:Instalan cámaras para identificar a las personas que depositen basura ilegalmente en las calles de El Bronx


“Las cámaras funcionarán las 24 horas del día e identificarán a las personas o placas de autos de quienes depositen basura sin autorización en la calle. El concejal Rafael Salamanca afirmó que los infractores podrían enfrentar multas de $4,000. Además, si un vehículo es captado violando la norma por tercera vez en menos de un año y medio, este será puesto en subasta y su dueño no podrá comprarlo de nuevo

UPCOMING EVENTS

MAYOR ADAMS ANNOUNCES CITY EXPANSION OF MENTAL HEALTH HELPLINE NYC WELL, STRENGTHENING FOUNDATION FOR FEDERAL 988 CRISIS LINE


Additional State Funding Will Allow NYC Well to Answer Up to 500,000 Calls, Texts, Chats From New Yorkers in FY2023  


Nationwide 988 Line Launched on Saturday, July 16th 


City Urges Federal Government to Speedily Resolve Geolocation Issues, So All New Yorkers Can Automatically Reach NYC Well When Calling 988 


 New York City Mayor Eric Adams, the New York City Department of Health and Mental Hygiene (DOHMH), and the Mayor’s Office of Community Mental Health (OCMH) today announced that New York City will expand its successful, free mental health helpline, NYC Well — strengthening the foundation for the federal 988 crisis line. New York City already far exceeds the federal standards for 988, but this expansion — funded by a $10.8 million investment from the New York State Office of Mental Health (OMH) — will provide more staff for increased access to crisis counseling, peer support, information, and referral to ongoing behavioral health services. The increase in capacity will allow NYC Well counselors and peer support specialists, specifically, to answer up to 500,000 calls, texts and chats from New Yorkers between July 2022 and June 2023 — a nearly 20 percent increase in capacity from the previous year.  


Mayor Adams also today urged the federal government to resolve geolocation issues with 988, so all people in New York City who dial or text 988 are automatically connected to New York City’s mental health helpline, NYC Well, and not to a counselor located in an area associated with the area code where their cell phone number is based. Currently, if the referring person calls 988 from a non-New York City area code, they will be routed to the National Suicide Prevention Lifeline hotline that is associated with their area code, and then manually transferred to NYC Well. While the federal government works to resolve this issue, the city encourages all New Yorkers, especially those without a New York City area code, to continue to call NYC Well at 888-NYC-WELL to best ensure a direct connection to NYC Well’s array of services without a need for manual redirection. 


“The expansion of NYC Well means more New Yorkers served with critical mental health resources and support, whenever, and however they need,” said Mayor Adams. “New York City’s NYC Well line already far exceeds federal standards and as the rollout of the 988 crisis line continues, I urge the federal government to quickly resolve the geolocation issues present so all New Yorkers, regardless of area code, can automatically reach our local, comprehensive services. I’m also grateful to Governor Hochul and the New York State Office of Mental Health for this funding that will allow us to reach even more New Yorkers.” 


“For any New Yorker struggling with anxiety, depression, or mental health challenges of any kind, you should know that the city is working to streamline services in conjunction with the state and federal government,” said Deputy Mayor for Health and Human Services Anne Williams-Isom. “The steps announced today will do just that. NYC Well is here for you, when you need it.


As we address the lasting trauma, pain and anxiety caused by the pandemic, this investment in NYC Well will be critical in serving more New Yorkers’ mental health needs,” said DOHMH Commissioner Dr. Ashwin Vasan. “These resources will ensure that New York City remains a national leader in providing on-demand mental health services to people experiencing crisis, and that we lay the groundwork to be a leader in implementation of the federal 988 crisis hotline in the coming months and years. We are committed to ensuring, whatever number is dialed in the near term, that New Yorkers get the mental health supports they need and have grown to rely on through NYC Well. I thank the New York State Office of Mental Health for this investment in New York City’s future.” 


“COVID-19 has deeply affected our communities, and its impacts will be felt for years to come,” said DOHMH Acting Executive Deputy Commissioner of Mental Hygiene Dr. Michael McRae. “If you’re struggling with your mental health or substance use, know that support is always available to you. Reach out to NYC Well.”
 

“The city is committed to ensuring that all New Yorkers can access mental health support where, when, and how they need it. We thank the state for supporting 988 implementation by adding funding for NYC Well — a lifeline, especially in communities of color, where too many barriers have prevented individuals and families from receiving services,” said Tina Chiu and Jason Hansman, acting co-directors, Mayor’s Office of Community Mental Health. “One of the biggest challenges to accessing appropriate mental health services, including crisis support, is knowing where to turn, and we appreciate our partnership with the DOHMH on implementing this vital program. This new investment will enable NYC Well to make those connections and provide high-quality service to more New Yorkers 24 hours a day, seven days a week.” 


Now that 988 has come online, in New York City, only calls and texts to 988 from the following area codes are being automatically routed to NYC Well counselors: 212, 332, 347, 646, 718, 917, and 929. This creates another point of access to NYC Well, and callers will have access to the same services provided to others who call, text, or chat with NYC Well counselors. New York City is committed to being a national leader in 988 implementation, and the announcement of today’s resources will ensure that the introduction of this critical federal tool builds off of the strong infrastructure created by NYC Well.  


NYC Well provides a point of entry to the city’s mental health and substance use services via comprehensive 24/7/365 support by calling 888-NYC-WELL (888-692-9355), text messaging “WELL” to 65173, or use of NYC Well’s web-based chatNYC Well provides robust crisis counseling, referrals to ongoing care, help with scheduling appointments, connection to mobile crisis services, peer support, and follow-up.  


When New Yorkers reach out to NYC Well, they will be connected to a trained counselor or peer support specialist — someone with lived experience with mental health and/or substance use challenges — who will listen and support them. Services are free and confidential, regardless of insurance or immigration status. Translation is available in more than 200 languages. New York City has been expanding NYC Well capacity since the program launched in October 2016, in response to rising demand for the service. 


If a New Yorker or someone they know is at immediate risk of hurting themselves, or in immediate danger, they should call 911.

Through round-the-clock support, NYC Well has been a lifeline for communities across New York City. This investment comes at a critical time as mental health needs have increased and 988 will make reaching out for help even more easily accessible, said Kimberly Williams, president and CEO, Vibrant Emotional Health — the administrators of NYC Well and the National Suicide Prevention LifelineWe are grateful for the New York State Office of Mental Health's support of 988 implementation and pleased to partner with the New York City Department of Health and Mental Hygiene and the Mayor’s Office of Community Mental Health to bring this vital resource to even more New Yorkers in need of mental health support.” 


“This is a unique moment where we must do all we can to meet people where they are and help them in their time of need,” said Dr. Benjamin F. Miller, president, Well Being TrustThe city’s ongoing commitment to strengthening NYC Well represents an investment in the people of New York and an opportunity to carefully consider how we approach issues of mental health, substance misuse, and suicide prevention and a major glidepath towards broader 988 implementation. 988 is a significant opportunity to change the way we approach mental health in our nation, and this expansion and financial commitment will not only help enhance the capacity of the current NYC Well system, but also build out much needed infrastructure for a robust 988 crisis response system.” 


2022 Q2 Report Reveals Sustained Filing Volume From April Through June In New York City


Figures for new construction permit filings for New York City for the second quarter of 2022 are in, and YIMBY’s latest analysis reveals that a number of positive trends emergent in the year’s first quarter have continued at a sustained pace. During the period spanning April, May, and June, the Department of Buildings registered permit filings for a combined total of around 13.1 million square feet, which, among other uses, includes 9,997 residential and hotel rooms. Although the square footage of the average filing is slightly smaller compared to the first quarter, the 857 new permits filed in the second quarter almost exactly match the total of 862 filings in the previous quarter, with both figures substantially exceeding quarterly averages from the previous year. Below we share a detailed analysis of the aggregated permit data.

Number of permit filings per month

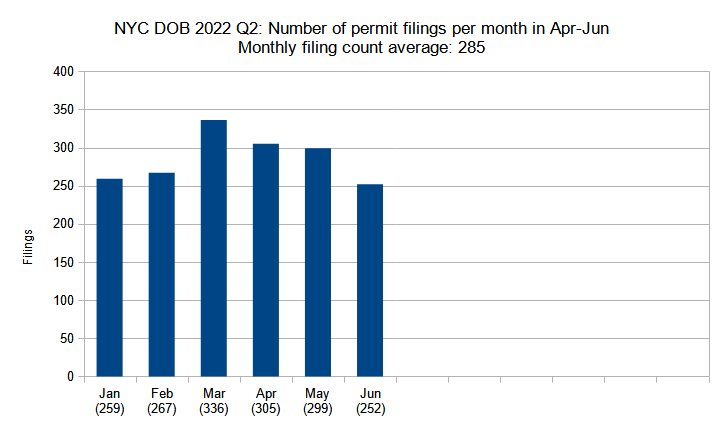
Number of new construction permits filed per month in New York City in Q1-Q2 (January through June) 2022. Data source: the Department of Buildings. Data aggregation and graphics credit: Vitali Ogorodnikov

Number of new construction permits filed per month in New York City in Q1-Q2 (January through June) 2022. Data source: the Department of Buildings. Data aggregation and graphics credit: Vitali Ogorodnikov

Over the second quarter of the year, the monthly average number of new construction filings has remained remarkably consistent with that of the first quarter. The average monthly permit count for April, May, and June of 285 is almost identical to that of January, February, and May, which averaged at 287.

This finding is great news for the city’s construction industry. The first quarter’s figure nearly doubled last year’s monthly filing average of 168; even its lowest monthly total (January, with 259 filings) significantly outpaces last year’s best-performing month (December, with 219 filings). In turn, the quarter’s best performing month, March with 336 filings, more than tripled last March’s total of 103 filings.

Since the second quarter’s average matches that of the first, it means that the permit surge observed in Q1 was not an aberration that would be followed by a drastic dip, but instead is indicative of a consistent trend that has so far held strong for at least half a year.

Number of permit filings by borough

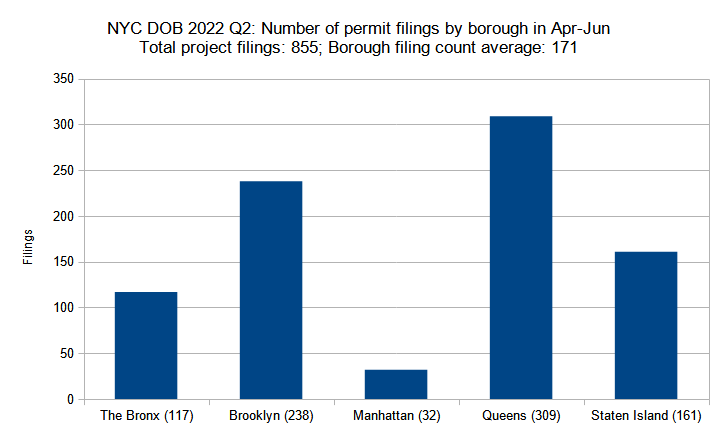
Number of new construction permits filed per borough in New York City in Q2 (April through June) 2022. Data source: the Department of Buildings. Data aggregation and graphics credit: Vitali Ogorodnikov

Number of new construction permits filed per borough in New York City in Q2 (April through June) 2022. Data source: the Department of Buildings. Data aggregation and graphics credit: Vitali Ogorodnikov

When comparing the bar graphs for the by-borough breakdown of permit filings for the first versus the second quarter, the similarity of the figures is striking, particularly in their by-share relation between the boroughs.

As before, Queens is well ahead of the pack with a total of 309 permits, slightly above the first quarter’s total of 287. Brooklyn has dipped slightly but still comes in second with 238 permits (versus Q1’s 264). Staten Island remains in third with 161 permits, slightly below Q1’s total of 176. The Bronx again comes in at number four, this time with 117 permits, a slight gain on Q1’s total of 99. Manhattan’s permit count is again by far the lowest, at 32 permits (versus last year’s 36).

The numbers may be explained by the same logic as in the last quarter: The larger boroughs have lower density and thus amass high counts with the majority of their filings for single- and two-family houses and garages. Denser boroughs on the other hand trend toward volume over quantity, with larger projects that are fewer in number.
Residential and hotel units filed per borough

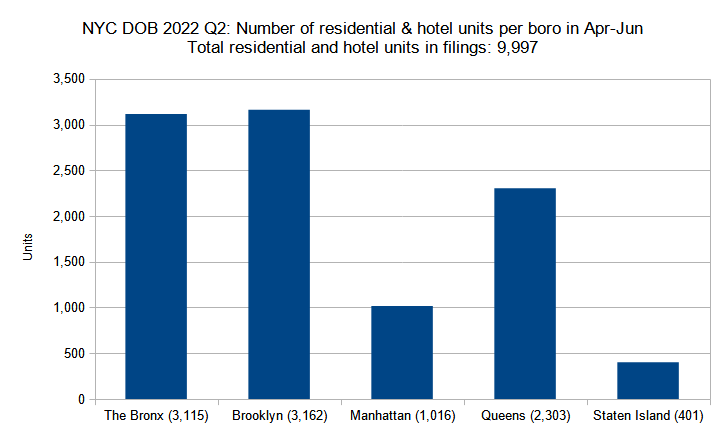
Number of residential and hotel units in new construction permits filed per borough in New York City in Q2 (April through June) 2022. Data source: the Department of Buildings. Data aggregation and graphics credit: Vitali Ogorodnikov

Number of residential and hotel units in new construction permits filed per borough in New York City in Q2 (April through June) 2022. Data source: the Department of Buildings. Data aggregation and graphics credit: Vitali Ogorodnikov

In contrast to the stasis of the previous chart, the dynamic shift between the total number of residential units (in a combined count) is much more intriguing. Of course, the primary difference is that the second quarter’s total unit count is nearly half last quarter’s figure, with 9,997 for Q1 versus 19,337 for Q2.

Just as interesting is the shift within the per-borough unit counts. The Bronx held very steady, with 3,115 units in Q2 versus 3,160 units in Q1, with roughly one-sixth of the total belonging to the 562-unit proposal at 1580 Story Avenue, the project with the highest unit count in the city in Q2. By contrast, the figure for Brooklyn has plummeted from 9,936 in Q1 (almost equal to Q2’s five-borough total) nearly three times, to 3,162 in Q2 (which, curiously, still keeps it in the citywide lead).

Manhattan’s count fell by about a third, from 1,690 units in Q1 down to 1,016 units in Q2. The count for Queens dropped by a similar share, from 3,616 in Q1 down to 2,303 in Q2, with one-fifth of the units coming from the 500-unit development planned at 43-02 Ditmars Boulevard. Staten Island’s count fell by more than 200 percent, from 935 in Q1 to 401 in Q2, with half of the units attributable to the 201-unit development planned at 364 Bay Street, which holds the fourth-highest unit count for any permit in the city in Q2.

Permits listed by unit count per filing
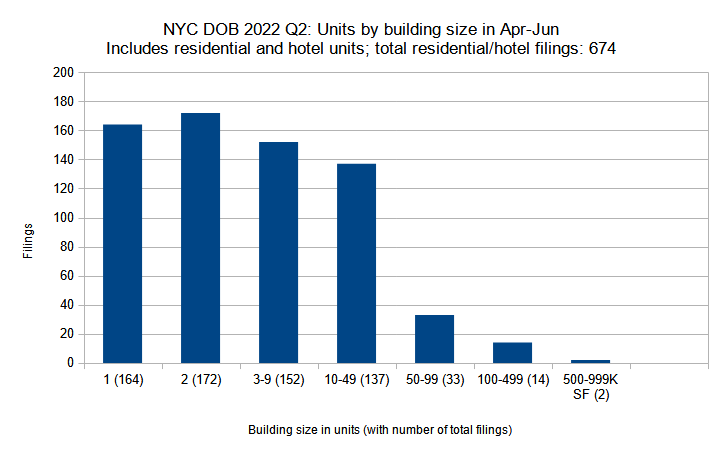
New residential and hotel construction permits filed in New York City in Q2 (April through June) 2022 grouped by unit count per filling. Data source: the Department of Buildings. Data aggregation and graphics credit: Vitali Ogorodnikov

New residential and hotel construction permits filed in New York City in Q2 (April through June) 2022 grouped by unit count per filling. Data source: the Department of Buildings. Data aggregation and graphics credit: Vitali Ogorodnikov

So what is behind such a drastic drop-off for the total unit count between the first and the second quarters? Although the following analysis, which groups permits by size via unit counts, may not explain the full picture, it at least reveals one particular trend: a notable decrease in filings for high-density buildings.

Between the first and second quarter, filing counts remained rather consistent for categories ranging from single-family houses to medium-sized apartment buildings (up to 49 units). The single-family house filings went from 150 in Q1 to 164 in Q2. Two-family house filings dipped slightly from 191 filings and a total of 382 units in Q1 to 172 filings and a total of 344 units in Q2.

The stats for the small apartment buildings and hotels (three to nine units) rose from 132 filings with a total of 382 units in Q1 to 152 filings and 848 units in Q2. The medium apartment building and hotel category (ten to 49 units) slid from 147 filings with a total of 3,392 units in Q1 to 137 filings with a total of 3,105 units in Q2.

The next two categories, which account for large apartment buildings, are responsible for the significant drop in the total unit count between the two quarters. The group with filings with 50 to 99 units dropped from 50 filings with 3,614 units in Q1 to 33 filings with 2,263 units in Q2, although this figure is still well above last year’s quarterly average of 23. More notably, the group with planned buildings with 100 to 499 units plunged from 50 filings and 11,075 units in Q1 down to 14 filings and just 2,212 units in Q2, falling below last year’s quarterly average of 24 filings.

Curiously, the largest filings observed in the second quarter, the 562-unit development at 1580 Story Avenue in The Bronx and the 500-unit development proposed at 43-02 Ditmars Boulevard in Queens, are larger than any filing observed in the first quarter, none of which surpassed the 500-unit mark.

Permit filings by floor count categories
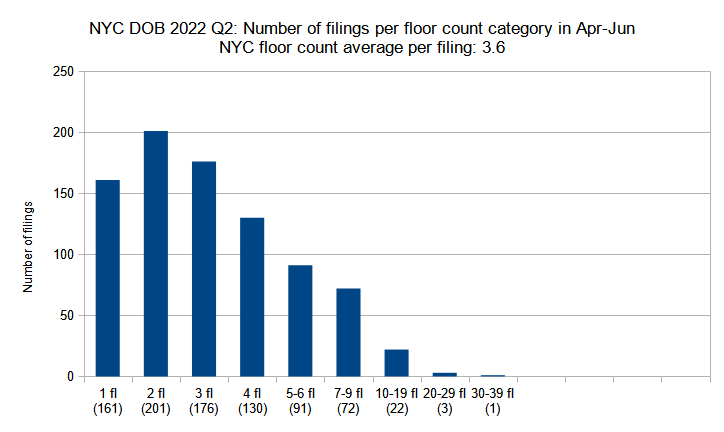
New construction permits filed in New York City in Q2 (April through June) 2022 grouped by floor count. Data source: the Department of Buildings. Data aggregation and graphics credit: Vitali Ogorodnikov

New construction permits filed in New York City in Q2 (April through June) 2022 grouped by floor count. Data source: the Department of Buildings. Data aggregation and graphics credit: Vitali Ogorodnikov

In the previous analysis, we discovered that the second quarter of 2022 shows a significantly decreased number of filings for large apartment buildings and hotels compared to the first quarter of the year. Since larger unit counts generally translate to greater height (aside from rare exceptions such as slender luxury supertall towers), we may also expect a lower filing count for buildings with more floors.

Regrettably for skyline watchers, the numbers reciprocate the expectation. While low- and mid-rise filings (six floors and under) have remained generally consistent since the previous quarter, filings for taller buildings have dipped significantly. This results in a lowering in average floor count per filing from 4.3 in Q1 down to 3.6 in Q2, a startling decrease from a figure that has stayed remarkably consistent for some time, averaging 4.1 floors per filing in 2020 and 4.3 in 2021.

Single-story buildings saw the greatest increase between Q1 and Q2, increasing by around half from 110 to 161. Two-story filings saw a slightly lower growth, rising from 182 to 201. Significant growth in these two low-rise categories, rather than just a sheer drop-off in high-rise filings, also makes a significant impact on the lower quarterly floor count average.

In turn, three-story filings dipped slightly, from 215 in Q1 down to 176 in Q2. Four-story filings rose from 108 in Q1 to 130 in Q2. Five- and six-story filings also rose slightly, from 88 in Q1 to 91 in Q2.

From here on, the figures trend steadily downward. Filings for mid-high-rise buildings (seven to nine floors) dipped by just over a quarter, from 104 in Q1 down to 72 in Q2. Filings in the ten- to 19-story category lowered nearly by half, from 40 in Q1 to 22 in Q2. Filings in the 20-29-story category plummeted from 13 in Q1 to just three in Q2. Finally, filings in the 30-39-floor category have decreased from two to one.

The five buildings with the highest floor counts that arrived on the permit lists in the second quarter were 567 Third Avenue (34 stories) and 76 Varick Street (27 stories) in Manhattan, 6128 8th Avenue (21 stories) and 88 Schermerhorn Street (20 stories) in Brooklyn, and 24-03 Queens Plaza North and 1580 Story Avenue (19 stories each) in Queens and The Bronx, respectively.

Average number of floors per filing per borough
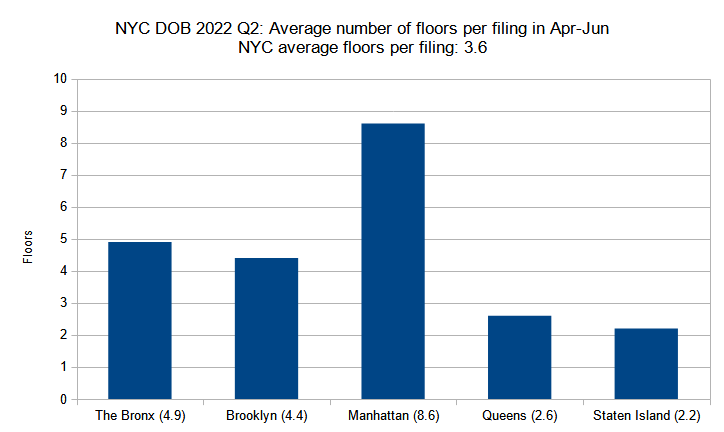
Average number of floors per new construction permit per borough filed in New York City in Q2 (April through June) 2022. Data source: the Department of Buildings. Data aggregation and graphics credit: Vitali Ogorodnikov

Average number of floors per new construction permit per borough filed in New York City in Q2 (April through June) 2022. Data source: the Department of Buildings. Data aggregation and graphics credit: Vitali Ogorodnikov

When tallied by average floor count per filing by borough, the pattern for the second quarter of 2022 continues to reflect the established trend. Predominantly mid- and high-rise Manhattan has by far the highest average floor count; the still-dense but flatter Brooklyn and The Bronx are notably lower; Queens and Staten Island, with their wide swathes of lower-density housing (particularly Staten Island), register lower still.

However, responding to the above-mentioned trend of fewer high-rise filings, floor count averages for each borough lowered rather proportionally. Manhattan dipped from 10.1 floors per average filing in the first quarter down to 8.8 in the second quarter; The Bronx lowered from 5.6 in Q1 to 4.9 in Q2; Brooklyn decreased from 5.6 in Q1 to 4.4 in Q2; Queens slipped from 3.0 in Q1 to 2.6 in Q2; and Staten Island decreased from an average of 2.6 in Q1 down to 2.2 in Q2.

For those keeping track, last year’s averages were 15.1 floors for Manhattan, 5.3 for Brooklyn, 5.2 for The Bronx, 3.0 for Queens, and 2.3 in Staten Island.

Total floor area filed by borough
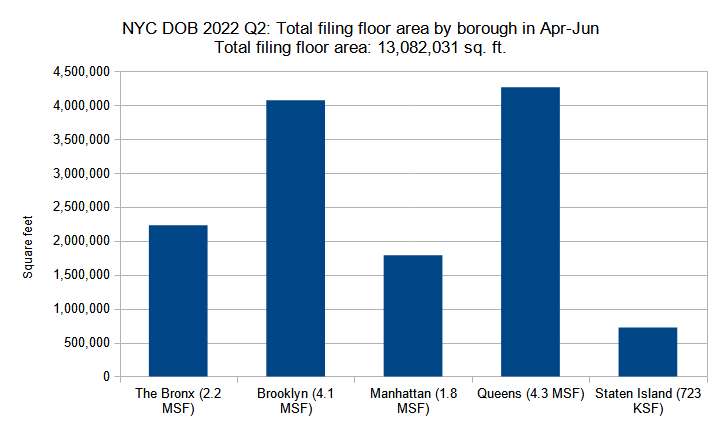
Combined floor area of new construction permits filed per borough in New York City in Q2 (April through June) 2022. Data source: the Department of Buildings. Data aggregation and graphics credit: Vitali Ogorodnikov

Combined floor area of new construction permits filed per borough in New York City in Q2 (April through June) 2022. Data source: the Department of Buildings. Data aggregation and graphics credit: Vitali Ogorodnikov

Although the total filing count has remained virtually the same between the first and second quarters of 2022, the precipitous drop in total unit counts combined with the fact that a large number of behemoth-sized office buildings are already under construction rather than still on the drawing boards, it is hardly surprising to see a concurrent drop in total filing floor area. Namely, the figure has decreased by 42 percent, from 22.4 million square feet in Q1 down to 13.1 million square feet in Q2.

Also telling of changing trends are the figure differences between the boroughs. The Bronx has remained steady, dipping from 2.4 million square feet in Q1 down to 2.2 million square feet in Q2. By contrast, Brooklyn, which in Q1 held an 11.3-million-square-feet total that relatively equaled the rest of the boroughs combined, in Q2 has plummeted down to 4.1 million square feet, lowering slightly below Queens (4.3 million square feet) though though still nearly doubling that of The Bronx.

Though Queens is now in the first place citywide, it still lowered significantly from the first quarter’s 5.4 million square feet. Manhattan, with its ever-tightening supply of construction-ready space, remains at fourth place, decreasing slightly from two to 1.8 million square feet. Staten Island, consistently notable for its predominantly low-scale construction, has dipped into the six-digits, lowering from 1.2 million square feet in Q1 down to around 723,000 square feet in Q2.

Average floor area per permit filing by borough
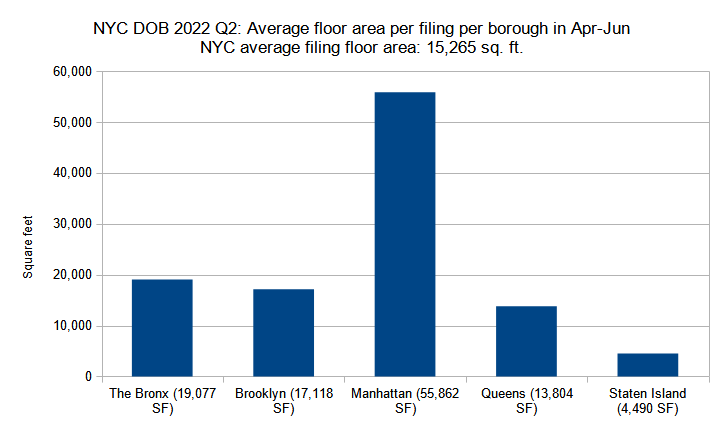
Average floor area per new construction permit per borough filed in New York City in Q2 (April through June) 2022. Data source: the Department of Buildings. Data aggregation and graphics credit: Vitali Ogorodnikov

Average floor area per new construction permit per borough filed in New York City in Q2 (April through June) 2022. Data source: the Department of Buildings. Data aggregation and graphics credit: Vitali Ogorodnikov

As indicated in above analyses, the total number of construction permit filings in New York City between the first and second quarters of 2022 has remained virtually the same (862 in Q1 versus 857 in Q2), yet the total volume of filed-for floor area has decreased nearly by half (from 22.4 million square feet in Q1 down to 13.1 million square feet in Q2). A basic inference would suggest that the average filing size has decreased notably during the period. This is confirmed by our tally, which discovers that the average filing size has dropped from 25,990 square feet in Q1 down to 15,265 square feet in Q2.

However, the decrease was not observed equally in all boroughs. The size of the average filing in The Bronx has somewhat lowered, from 25,893 square feet per filing in Q1 down to 19,077 square feet per filing in Q2. Queens and Staten Island have observed similarly moderate decreases, from 18,802 square feet in Q1 down to 13,804 square feet in Q2, and from 6,719 square feet in Q1 down to 4,490 square feet in Q2, respectively.

Crowded Manhattan, where dense development remains more lucrative than in any other borough, has not only maintained its vast lead in terms of square footage per average filing, but has actually slightly increased it, going from 55,316 square feet per average filing in Q1 to 55,862 square feet in Q2.

Four out of five of the largest filings by square footage in the second quarter may be found in Queens. The city’s largest filing for Q2 is 43-02 Ditmars Boulevard in northern Astoria, where an eight-story, 529,234-square-foot, 500-unit development is proposed. The second-largest development is the 27-story, 47,415-square-foot office and community services building is planned at 76 Varick Street in Hudson Square, Manhattan. Next is the five-story, 339,740-square-foot building planned at 48-02 48th Avenue in the southeastern corner of Sunnyside, Queens. Rounding off the list is a pair of towers in Queens that will span a prime subway-adjacent site in Downtown Flushing39-18 Janet Place, which will rise 15 stories and span 331,392 square feet, and 39-08 Janet Place, which will stand 18 stories and span 298,713 square feet.

In summary, the Department of Buildings data for new construction permits filed for in the second quarter of 2022 allows us to draw certain intriguing conclusions. When YIMBY released its report last quarter, we wondered if the city’s development industry would be able to sustain the unusually high volume of permits that we observed at the time. And although the total square footage and unit count have somewhat readjusted closer to last year’s values, the fact that the city registered effectively as many new permit filings as it did in the previous quarter, well eclipsing the figure for the previous year, is encouraging.

Nevertheless, though 10,000 units may sound like a formidable figure, it still falls far short of what the city needs to address its acute housing crisis. The lowering of the total unit count cannot plausibly be explained by a lack of demand, as recent studies show that more people are moving into Manhattan than before the pandemic, even though the borough is registering record-breaking rent prices.

In essence, the problems of overpriced rent and apartment shortages may be alleviated via the elementary principles of supply and demand: if a commodity is in shortage, we must either decrease demand for the commodity or increase its availability. There’s no sight for the decrease of housing demand, with people continuing to move into the city en masse and New Yorkers looking to improve their options and housing pricing.

As such, the only other alternative is to dramatically increase the supply of housing. And though we must continue to introduce commensurate infrastructure improvements for the new development, the greatest hurdles to this obvious solution are restrictive zoning policies, bureaucracy, and obstinate NIMBY opposition.

Despite its current scale, New York City remains capable of accommodating a large volume of new construction, particularly along underbuilt, transit-accessible areas in the outer boroughs. Likewise, the waterfront would be able to provide much more housing if the city made a significant expansion of its ferry system in all five boroughs.

And while resident displacement in establishment neighborhoods is a complex issue, a notion that any new housing will drive prices up for existing residents is a myth that has been thoroughly debunked. A number of studies (examples: onetwo, and three) have shown that even luxury development is likely to lower neighborhood living prices for all incomes, and that restriction of new construction increases unaffordability and exacerbates inequality. In oversimplified terms, newcomers are likely to move into newly desirable neighborhoods regardless of housing supply, and if they cannot move into a brand new building, they instead are much more likely to outbid, buy out, or otherwise displace residents already living in the vicinity.

The city and the world at large are currently facing complicated challenges. The issue of housing shortage, however, is generally a self-inflicted one, which may be significantly alleviated with a shift of policy and urban mindset. New Yorkers are already looking to rent and buy housing. Developers are already looking to build. As such, we must find ways to prudently expedite the planning and construction process, upzone areas that can objectively handle significant new development, demand that our politicians keep up with the infrastructure (transit, schools, sewage, etc.) necessary to support such development, and convince our neighbors that saying Yes In My Back Yard to new development benefits us as a community both in the short and the long run.

Governor Hochul Directs State Agencies to Enhance Shark Monitoring at Long Island Beaches

 Jones Beach

State Agencies Increase Lifeguard Staffing, Patrols, and Drone Beach Surveillance To Detect Shark Activity and Help Prevent Shark Encounters

Expands Public Outreach on Shark Safety Resources and Education


 Governor Kathy Hochul today directed the Office of Parks, Recreation and Historic Preservation, the Department of Environmental Conservation, and the State Police to implement heightened patrols and surveillance of shark activity, including drone and helicopter monitoring, along the Long Island State Park Beaches due to recent shark encounters in the Atlantic Ocean waters off of the South Shore. The Governor also directed state agencies to expand public outreach efforts on shark safety resources and education to help beachgoers stay safe.

"As New Yorkers and visitors alike head to our beautiful Long Island beaches to enjoy the summer, our top priority is their safety," Governor Hochul said. "We are taking action to expand patrols for sharks and protect beachgoers from potentially dangerous situations. I encourage all New Yorkers to listen to local authorities and take precautions to help ensure safe and responsible beach trips this summer."

At the Governor's direction, State Parks will increase lifeguard staffing through overtime at ocean beaches by 25 percent. This will translate to approximately two to four lifeguards within each field, which will boost surveillance for sharks and other marine life from the shore, by surfboats, and through an enhanced drone beach surveillance program. There will also be additional surveillance measures through expanded drone availability, increasing from one to three available drones at Jones Beach State Park and one to two available drones at Robert Moses State Park, and Hither Hills State Park will be assigned its first drone. Park Police also have one drone available to respond as needed. Drone surveillance capabilities at Long Island State Park beaches will also expand from the current four miles to 11 miles. Additionally, State Parks has acquired extra drone batteries and rapid battery chargers to extend the duration of available drone surveillance. Long Island State Parks has 13 certified drone operators, with six more operators expected to complete certification in the coming weeks.

Other new actions include:

  • Deploying Park Police patrol boats to search the water.
  • Dispatching New York State Police helicopter patrols over the South Shore waters.
  • Distributing outreach materials focused on education via social media, DEC listserv, and website to the public.
  • Bolstering federal, state, county, and local partnerships to share resources and information about potential shark sightings and better support correct identification of sharks and other fish.

Under State Park shark safety guidelines, swimming is suspended following a shark sighting so the shoreline can be inspected by drone. Swimming is only allowed to resume at least an hour after the last sighting in order to better protect beach visitors. All sightings are referred to the Long Island Coastal Awareness Group, which consists of 180 individuals from municipalities, agencies, and private beach operators stretching from Queens through Long Island. State Park lifeguards are continuously scanning and patrolling the waters and are on the lookout for any sharks or other potentially dangerous marine life.

To minimize the risk of shark interactions, the New York State Department of Environmental Conservation advises the following shark safety tips:

  • Avoid areas with seals.
  • Avoid areas with schools of bait fish, often characterized by fish splashing on the surface, diving sea birds, or the presence of marine mammals such as dolphins.
  • Avoid areas where people are fishing.
  • Avoid swimming in the ocean at dusk, dawn, or nighttime.
  • Avoid murky water.
  • Avoid isolation. Swim, paddle, kayak, and surf in groups.
  • Swim close to shore, where your feet can touch the bottom.
  • Always follow the instructions of lifeguards and Parks staff.
  • Adhere to all signage at beaches.