As New York City abounds with fresh spring blooms, New York YIMBY has fresh numbers reflecting the permit filing activity that took place in the first quarter of 2023. In the period spanning from January through March, the Department of Buildings registered permits for 840 new buildings (surpassing last year’s quarterly average of 806), combining for a total of 13.4 million square feet. Of these, 668 building will be allocated for residential and hotel use, and will contribute a total of 9,138 units to the city. The full quarterly report, summarized below in a series of custom charts and analyses, is available with a subscription to YIMBY’s Building Wire.
Number of permit filings per month
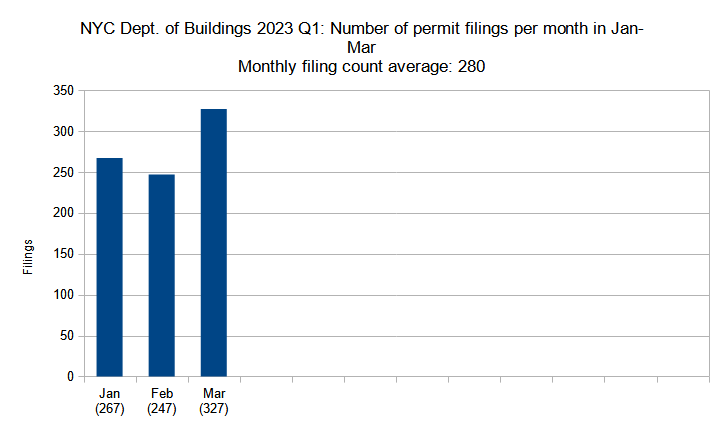
Number of new construction permits filed per month in New York City in Q1 (January through March) 2023. Data source: the Department of Buildings. Data aggregation and graphics credit: Vitali Ogorodnikov
As last year’s annual report showed, monthly filing figures for new buildings, averaging 269 per month, have generally remained stable throughout the year; however, a slight dip in the second half of the year, especially in its last quarter, gave us cause for concern that the downward trend would continue into 2023. Fortunately, this year’s first quarter boasted a strong three-month showing with a monthly average of 280 permits, considerably surpassing last year’s average of 269 and leaving in the dust the 2021 monthly average of 168.
January registered a total of 267 filings, surpassing December’s total of 188 by a whopping 42 percent and eclipsing last year’s respective January figure of 259 filings. The 247 filings in February reflect a slight drop, yet filing activity surged well ahead in March with a total of 327 filings. Last year, only one month had a better showing (also March, with 336 filings), and none of the monthly tallies came even close in 2021, when the highest tally registered in December with 219 filings.
601 West 29th Street (right) and the Hudson Yards skyline. Photo by Michael Young
Number of permit filings by borough
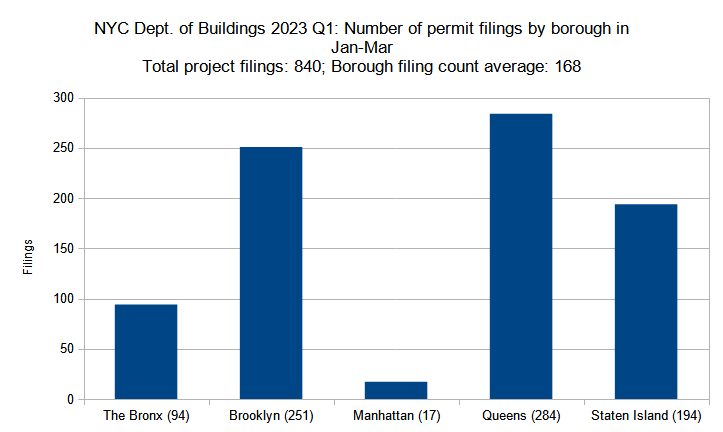
Number of new construction permits filed per borough in New York City in Q1 (January through March) 2023. Data source: the Department of Buildings. Data aggregation and graphics credit: Vitali Ogorodnikov
When sorted by borough, the general trend for new building permit filings in the first quarter of 2023 very closely follows that from the previous quarter and more or less resembles our observations from other prior quarters.
Just as in Q4 2022, Queens lead the pack with 284 filings, a 26 percent increase above last quarter. Brooklyn followed closely with 251 filings, a 17 percent increase during the three-month period. Staten Island showed a similar rate of increase, where the 194 filings in Q1 represent a 19 percent bump up from the prior period.
The tally for the Bronx remained steady, dropping by a single filing from the previous quarter to a Q1 total of 94. Manhattan displayed the most significant decrease, where the Q1 2023 total of 17 reflects a nearly 58 percent drop from the previous quarterly total of 40.

One Madison Avenue (center). Photo by Michael Young
Residential and hotel units filed per borough
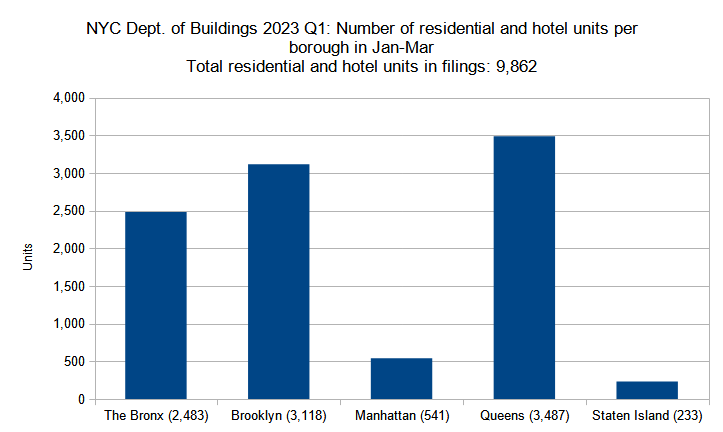
Number of residential and hotel units in new construction permits filed per borough in New York City in Q1 (January through March) 2023. Data source: the Department of Buildings. Data aggregation and graphics credit: Vitali Ogorodnikov
While the total number of filings in the first quarter of 2023 (840) significantly surpasses that of the previous quarter (738), the total number of residential and hotel units within the filings decreased by over 3,000, dropping from 13,030 in Q4 2022 down to 9,862 in Q1 2023.
Concurrently, the trend line also shifted dramatically, with some boroughs displaying much more significant number shifts than others. The total for the Bronx dropped by one-sixth, from 3,018 in Q4 2022 down to 2,483 in Q1 2023, lowering from second to third place among the boroughs. By contrast, Brooklyn, which nearly matched the Bronx in the last quarter, edged ahead to second place by rising from 2,991 units in Q4 2022 to 3,118 in Q1 2023.
Reflecting its dramatic drop in total filings, Manhattan displayed the most significant decrease in filing unit count, plummeting nearly five-fold from a total of 2,351 units in Q4 2022 down to just 541 units in Q1 2023. In turn, Queens still leads the boroughs with a total of 3,487 units, albeit still dropping 27 percent from the previous quarter’s total of 4,777 units.
Low-density, remotely situated Staten Island remains in last place, though its 15 percent decrease from 275 units in Q4 2022 to 233 units in Q1 2023 is not the city’s most severe.
The filing with the highest unit count is found in Queens, where the 69-story, 824-unit tower proposed at 42-06 Orchard Street in Long Island City is poised to become the borough’s tallest. In Brooklyn, the highest unit count registers at 589 Fulton Street (Downtown Brooklyn, 591 units); in the Bronx, at 1959 Jerome Avenue (Morris Heights, 333 units); and in Manhattan, at 110 East 16th Street (Union Square, 150 units).
While Staten Island typically registers only a handful of multi-unit (three and more units) apartment building filings per quarter, not a single filing tallied over two units in Q1 2023.
1841 Broadway. Photo by Michael Young
Permits listed by unit count per filing
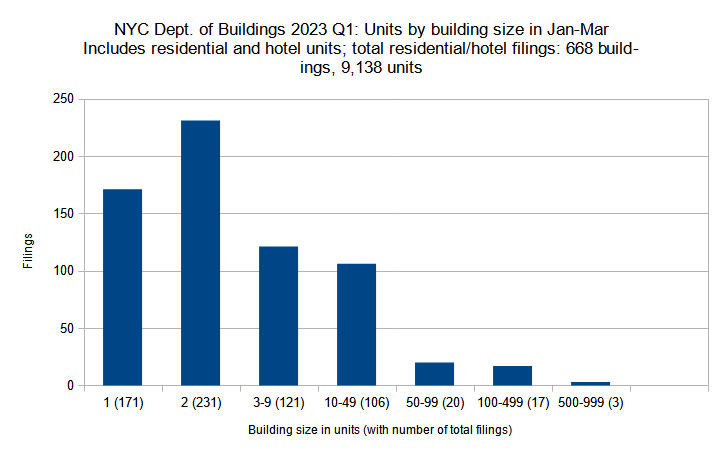
New residential and hotel construction permits filed in New York City in Q1 (January through March) 2023 grouped by unit count per filling. Data source: the Department of Buildings. Data aggregation and graphics credit: Vitali Ogorodnikov
The previous analyses revealed that between the last quarter of 2022 and the first quarter of 2023, the total number of building filings rose considerably while the total unit count also dropped by a non-negligible quantity. As such, we may extrapolate that the average filing dropped in its total unit count during the period, with the city displaying more smaller filings rather than fewer large ones.
An analysis of permits listed by unit count per filing not only confirms this theory, but also reveals that while the total number of small-building filings indeed increased, the 3,000-plus-unit count drop may be explained by a significant drop in large-building filings.
Between the two quarters, the number of single-family filings surged from 106 to 171, and two-family filings from 167 to 231. The number of small apartment building filings remained largely constant, with three- to nine-unit filings lowering from 124 to 121 and ten- to 49-unit filings increasing from 94 to 106.
The totals for large apartment buildings show more significant decreases. During the three-month period, the number of 50- to 99-unit filings decreased from 27 to 20; 100- to 499-unit filings fell from 34 to 17 (likely accounting for the majority of the total unit count decrease); and filings in the 500- to 999-unit range have dipped from three to two.
405 Park Avenue Photo by Michael Young
Permits listed by average unit count per filing
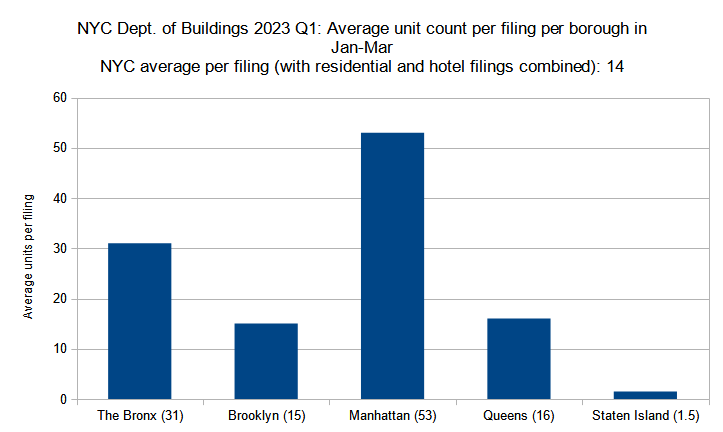
Average unit count (residential and hotel) per new construction permit per borough filed in New York City in Q1 (January through March) 2023. Data source: the Department of Buildings. Data aggregation and graphics credit: Vitali Ogorodnikov
In the previous analysis we observed that between the last quarter of 2022 and the first quarter of 2023, residential and hotel filings have averaged smaller unit counts. In the following analysis, we look at how these decreases have affected each of the five boroughs individually. Although the general trend line has remained consistent, relative decreases between the boroughs vary significantly.
The greatest decrease in the average unit count per residential filing took place in Manhattan. Although the borough still boasts by far the largest average filing size, between the two quarters the average filing unit count nearly halved, dropping from 91 down to 53. The Bronx still claims the second-largest average filings, though its average filing unit count dropped by roughly a quarter, from 43 to 31. Queens is also still in third place, though just barely, as its average filing unit count nearly halved from 28 to 16.
By contrast, average filing unit counts remained rather consistent in the two trailing boroughs. Between the two quarters, the average number of units per filing in Brooklyn dipped from 17 to 15 and remained virtually the same in predominantly single- and two-family Staten Island, sliding from 1.6 units per average residential filing in Q4 2022 to 1.5 units in Q1 2023.
Photo by Michael Young
Permit filings by floor count category
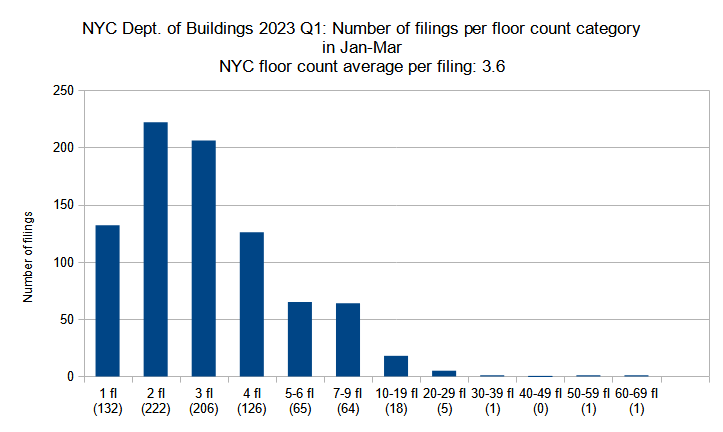
New construction permits filed in New York City in Q1 (January through March) 2023 grouped by floor count. Data source: the Department of Buildings. Data aggregation and graphics credit: Vitali Ogorodnikov
In the analyses outlined above, we observed two salient trends: First, between the fourth quarter of 2022 and the first quarter of 2023, the total number of filings grew, particularly in the residential category. Second, the average unit count per filing shrank as the result of more filings for smaller residential buildings and fewer for especially large multi-unit behemoths.
Given the reduction in average unit numbers, we would naturally also expect lower average floor counts; however, this data somewhat outperforms expectations. While the number of low-rise filings indeed increased notably, the number of mid- and high-rise filings remained stable, or even grew in some categories.
This discovery suggests that on average, tall buildings proposed in Q1 2023, particularly of the residential variety, have become slimmer, as the rather significant decreases in large multi-unit buildings does not correlate with relatively consistent floor counts.
Between the two quarters, the average floor count per filing dropped by half a story, from 4.1 floors in Q4 2022 to 3.6 floors in Q1 2022. This trend is generally attributable to a surge in low-rise filings, which rose from 115 to 132 filings for single-story buildings; from 165 to 222 for two-story filings; from 165 to 206 for three-story filings; and from 111 to 126 for four-story filings. With a notable increase in every floor count category, the total share of low-rise buildings rising four floors or below increased from 75 percent of the total in Q4 2022 to 82 percent of the total in Q1 2023.
For the most part, the changes in the taller building categories did not display any precipitous drops. From Q4 2022 to Q1 2023, the total number of filings in the five- to six-story category dipped from 71 to 65; the number of seven- to nine-story filings decreased from 69 to 64; and the number of 20- to 29-story filings slid from seven to five.
The only notable drop was observed for high-rise filings with ten to 19 floors, which lowered by around a third from 31 filings to 18. This decrease somewhat closely correlates with the 50 percent drop in filings for buildings in the 100- to 499-unit range during the period.
On the other hand, the number of building filings with the highest floor counts actually increased between the two quarters. While both quarters tally three filings with 30 or more stories, Q4 2022 had no filings over 39 floors, while Q1 2023 included one filing in the 60-story range and another in the 50-story category.
The filing with the highest floor count may be found in the booming Court Square section of Long Island City, Queens. Located one-and-a-quarter miles east of Midtown across the East River, the 69-story skyscraper at 42-06 Orchard Street is poised to become the tallest in the borough.
Of the ten filings with the highest floor counts, four are situated in Manhattan, while Brooklyn and Queens each have three. After the Orchard Street tower, the entries rank as follows: 589 Fulton Street (Downtown Brooklyn, 52 stories); 413 Ninth Avenue (Hudson Yards, Manhattan, 34 stories); 4 East 49th Street (Midtown, Manhattan, 29 stories); 126 East 57th Street (Midtown East, Manhattan, 28 stories); 147-35 95th Avenue (Jamaica, Queens, 24 stories); 110 East 16th Street (Union Square, Manhattan, 22 stories); 370 Livingston Street (Downtown Brooklyn, 22 stories); 60 Cedar Street (Bushwick, Brooklyn, 19 stories), and 45-15 Davis Street (Court Square/Long Island City, Queens, 17 stories).
The tallest filing in the Bronx (1959 Jerome Avenue, Morris Heights) ranks at 12th place with 15 stories. Staten Island expectedly lags in the skyline department, with its tallest filing being a seven-story building proposed at 400 Lake Avenue in Mariners Harbor.
Photo by Michael Young
Average number of floors per filing per borough
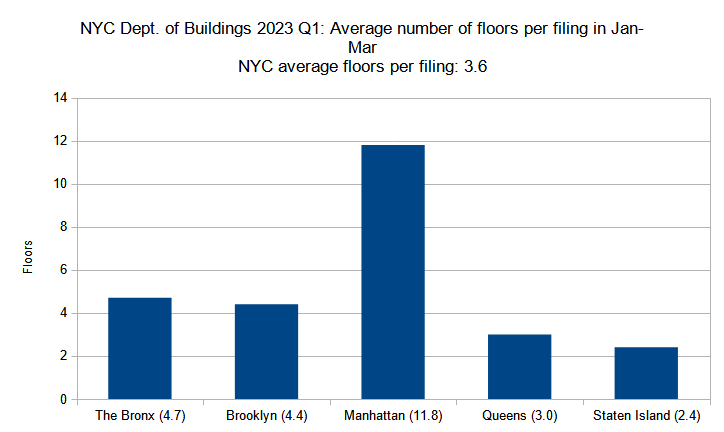
Average number of floors per new construction permit per borough filed in New York City in Q1 (January through March) 2023. Data source: the Department of Buildings. Data aggregation and graphics credit: Vitali Ogorodnikov
As noted above, despite a notable decrease in average unit counts per filing and a significant increase in low-rise filings, the number of mid- and high-rise filings remained largely consistent between the latest quarter and the preceding one, with a smaller-than-expected drop within the category. And while the average floor count per filing did dip from 4.1 in Q4 2022 to 3.6 in Q1 2023 (and saw a more gradual decline from last year’s quarterly average of 3.8), average filing floor counts per borough also remained rather consistent between the two quarters, and even showed some minor increases.
The overall trend line remained very similar between the two quarters, with Manhattan far ahead in first place; the Bronx and Brooklyn trailing well behind in second and third place, respectively; Queens in fourth, and Staten Island rounding off the ranking.
Still, even the most significant decrease between the two quarters, observed in the Bronx, is relatively minor, as its average filing floor count dropped from 5.1 to 4.7, or less than half a floor. The total for Queens dipped by a similar degree, lowering from 3.6 to 3 floors per average filing.
In turn, the three remaining boroughs saw increases. The average count per filing in Manhattan rose from 11 to 11.8 floors, from 4.2 to 4.4 floors in Brooklyn, and from 2.3 to 2.4 floors in Staten Island.
Photo by Michael Young
Total floor area filed by borough
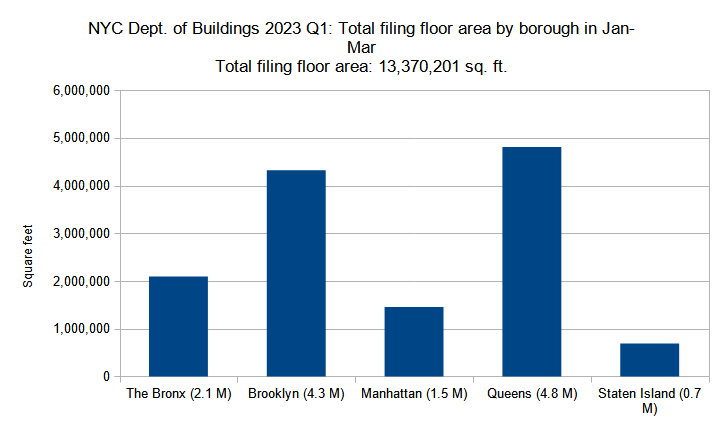
Combined floor area of new construction permits filed per borough in New York City in Q1 (January through March) 2023. Data source: the Department of Buildings. Data aggregation and graphics credit: Vitali Ogorodnikov
In earlier analyses we extrapolated that since mid- and high-rise filings have maintained generally consistent floor counts yet notably decreased in total unit counts, the buildings in these categories must have become more slender, packing many fewer units per typical floor. A breakdown by floor area reinforces this notion, as the total floor area of 13.4 million square feet filed for in Q1 2023 is a far cry from the 20.3 million figure from the prior quarter, again indicating a decrease in building bulk (the significant increase in single- and two-family filings during this period had only a minor effect on the total square footage, given the small size of the buildings in the respective groups).
Between 2021 and 2022, Queens was the greatest gainer in terms of total filed-for floor area, nearly doubling as it rose from 11.7 million square feet in 2021 to 19.4 million square feet in 2022. The rest of the boroughs displayed lesser fluctuations, with the Bronx rising from 7.3 to 9.7 MSF, Brooklyn increasing from 20.5 to 23.8 MSF, Manhattan dipping from 11.9 MSF to 10.1 MSF, and Staten Island rising from 2 to 3.3 million square feet.
As in the prior quarter, Queens boasted the highest volume of filed-for square footage, although its total has dropped from 6.2 million square feet in Q4 2022 down to 4.8 million square feet in Q1 2023. Brooklyn, still in second place, lowered from 5.5 MSF to 4.3 MSF. Manhattan dropped from third to fourth place, with a threefold reduction from 4.7 down to a paltry 1.5 MSF. This reduction has elevated the Bronx to third place, even as the borough reduced its total by one-third, from 3.2 to 2.1 MSF.
Only Staten Island noted an increase, rising from around 662,000 filed-for square feet in Q4 2022 to nearly 689,000 square feet in Q1 2023.
Photo by Michael Young
Average floor area per permit filing by borough
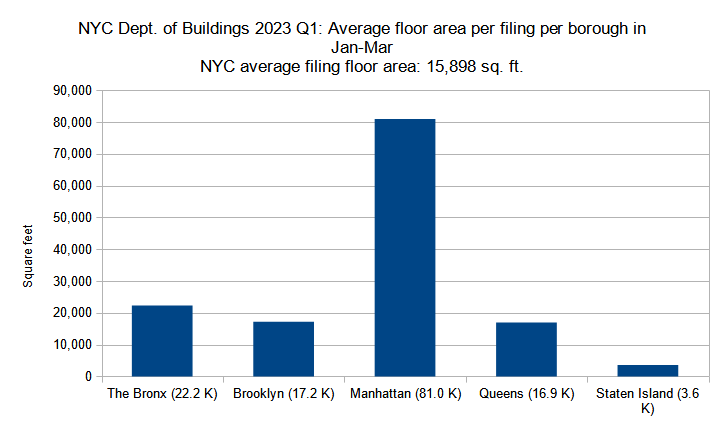
Average floor area per new construction permit per borough filed in New York City in Q1 (January through March) 2023. Data source: the Department of Buildings. Data aggregation and graphics credit: Vitali Ogorodnikov
Just as the total floor area filed for per borough dropped significantly between the last quarter of 2022 and the first quarter of 2023, so did the respective average filing square footages per borough.
By far the largest average filing sizes are still found in Manhattan, although between the two quarters, the average square footage decreased from 117,700 to 81,000. The Bronx, Brooklyn, and Queens still maintain square footages similar to one another, albeit sliding from 33,600 to 22,200, from 25,800 to 17,200, and from 27,700 to 16,900 square feet, respectively. Staten Island remains in last place with the smallest average filing square footages, dropping from an average of 4,000 square feet per filing in Q4 2022 to 3,600 square feet in Q1 2023.
The largest filing by square footage in Queens is found at 42-06 Orchard Street in Long Island City (801,916 square feet), which also has the highest floor count (69) and unit count (824) in the tally and is slated to become the tallest building in the borough.
The largest filing in Brooklyn is located at 589 Fulton Street in Downtown Brooklyn (597,824 square feet); in the Bronx at 1959 Jerome Avenue in Morris Heights (285,216 square feet); in Manhattan at 413 Ninth Avenue in Hudson Yards (283,551 square feet); and in Staten Island at 400 Lake Avenue in Mariners Harbor (51,134 square feet). These four filings also boast their respective boroughs’ highest floor and unit counts for the quarter, except for the Staten island entry, which does not include any residential space.
15 West 96th Street. Photo by Michael Young
Permits listed by floor area per filing
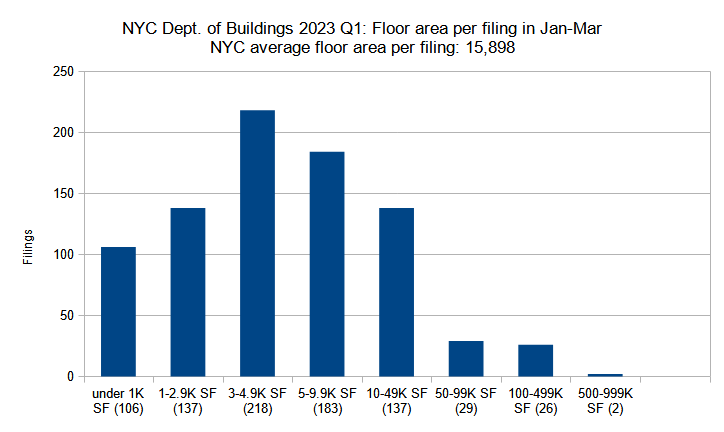
New construction permits filed in New York City in Q1 (January through March) 2023 grouped by total floor area. Data source: the Department of Buildings. Data aggregation and graphics credit: Vitali Ogorodnikov
In the section that tallied quarterly permit filings into categories by average residential and hotel unit counts, we observed that much of the quarter’s drop in total unit counts from the previous quarter may be attributed to a notable decrease in particularly large apartment buildings. A similar trend may be observed when building filings are grouped by square footage, where a minor decrease in large-floor-area filings is responsible for the majority of the overall square footage drop for the quarter.
The first quarter of 2023 tallied a total of 461 filings for buildings under 5,000 square feet, which generally cover garages, single- and two-family residences, and small apartment buildings; the number is only somewhat greater than the previous quarter’s corresponding tally of 399.
The two mid-size categories, representing medium-sized commercial and apartment buildings among other typologies, saw some of the greatest increases between the two quarters. The category for filings ranging between 5,000 and 10,000 square feet surged from 125 to 183 filings; the count in next category, with filings spanning from 10,000 to 50,000 square feet, rose from 126 to 137 during the period.
The filing counts drop more precipitously in the following categories, which represent the largest proposed buildings. Although the total filing counts are small in comparison to the preceding groups, the large square footages of individual filings, greater by more than a factor of ten than those in most of the preceding categories, have an outsized impact on the overall square footage.
Between Q4 2022 and Q1 2023, the number of filings for buildings spanning 50,000 to 100,000 square feet slipped from 37 to 29. The filing count for buildings measuring 100,000 to 500,000 square feet nearly halved from 45 to 26. The decline in this category, representing millions of square feet, is the most significant factor in the decrease of the filed-for floor area between the two quarters, from 20 to 13 million square feet.
Furthermore, the reduction among filings for buildings between 500,000 and 1 million square feet from four to two, and an absence of million-plus square-footers (one such building was filed for in the previous quarter) accounts for a further reduction of around 2 million square feet.
Of the quarter’s top five filings with the largest floor area, three are situated in Queens. At number one and two are the aforementioned 42-06 Orchard Street in Long Island City, Queens (801,916 square feet) and 589 Fulton Street in Downtown Brooklyn (597,824 square feet), respectively.
At numbers three and four are 174-35 95th Avenue and 94-15 Suthpin Boulevard, two proposals in Jamaica, Queens, rising 24 and 13 floors and spanning 488,280 and 302,840 square feet, respectively. Both are part of a rapidly developing high-rise hub adjacent to Jamaica Station on the Long Island Rail Road, the fourth-busiest rail station in North America.
Rounding off the top five is 1959 Jerome Avenue in Morris Heights in the Bronx, a development that will span 285,216 square feet.

Photo by Michael Young
In summary, the first quarter of 2023 saw filings for 840 buildings (668 residential and hotel), totaling 13.4 million square feet and 9,862 residential and hotel units. The average filing stands 3.6 stories tall and holds 15,898 square feet. For comparison, the fourth quarter of 2022 tallied 738 building filings (554 residential and hotel) with 20.3 million square feet with 13,030 residential and hotel units, with an average of 4.1 stories and 27,562 square feet per filing.
In other words, between the two quarters, the building filings became more numerous, although the increase generally took place among the smaller-scaled building categories. A notable reduction among buildings in the largest floor area and unit count categories is responsible for much of the drop in the total square footage and unit counts between the quarters. In the meantime, an increase in low-rise filings, as well as a drop in high-rise filings (ten stories and taller) from 41 to 26, reduced the average floor count.
While the numbers for total filings, floor area, and floor and unit counts fluctuated between the year’s first quarter and the preceding one, the fact remains that New York City is continuing its trajectory of growth by adding hundreds of new buildings, thousands of residential and hotel units, and millions of square feet of floor space onto its drawing boards every month. The 26 high-rise buildings proposed since the start of the year alone would constitute a minor skyline, which, crowned by towers reaching almost up to 70 stories, would be the envy of most mid-sized cities in the United States and beyond.
However, the pertinent question is whether the volume of building filings submitted to the Department of Buildings is enough to respond to the city’s current issues, such as its acute housing shortage. Judging by metrics such as record-setting rents, as well as a high residential demand and low supply that together preclude any chance of housing cost reduction in the foreseeable future, the answer is a resounding “no,” and the primary culprits are a lack of infrastructure improvements, as well as draconian, debilitating zoning restrictions that effectively forbid builders from supplying the housing that the city so desperately needs.
In regard to zoning, the greatest hurdle is the city’s absurdly low floor-to-area (FAR) limits. By the start of the twentieth century, it became clear to planners and ordinary citizens alike that unchecked development ran the risk of overwhelming the city with density, whether in the form of overcrowded, suffocating tenements or back-to-back gargantuan office towers. The original response was the Zoning Code of 1916, which not only segregated city zones by use, but also dictated setback regulations that eventually created the city’s famed Art Deco skyscraper silhouettes.
By the postwar period, the global planning community embraced ideals that were seemingly innovative at the time, but ended up backfiring and causing decades of communal damage that lingers to this day. Not only were cars and auto-centric environments such as the suburbs seen as the way of the future, but the very idea of density, today considered a cornerstone of vibrant urbanity, was considered outre, regressive, and downright dangerous.
New York City’s zoning ordinance of 1961 imposed floor-to-area ratio limits, which regulated the bulk of a building based on the ratio between its lot size and total floor area. This effectively put a cap on density, as it significantly downzoned vast portions of the city and ensured that the majority of its area cannot be developed as anything but single- and two-family households, even in transit-accessible areas. Even today, one study estimated that around 90 percent of Brooklyn properties within 0.6 miles of subway stops languish under an FAR of 2.5 or below, which is even less than that of a typical brownstone (with an FAR of 3.0).
As the result of these caps, the city is unable to keep up with an ever-growing demand for new housing, creating a relentless cycle of pricing increases that has resulted in record-setting rents and an acute housing crisis. Understandably, the crisis disproportionately affects the city’s most vulnerable communities, the working class and minority groups.
Thankfully, change finally appears to be on the horizon. New York Governor Kathy Hochul is in the midst of a legislative drive to overhaul the state’s zoning regulations to encourage the construction of up to 800,000 hew housing units over the next decade by relaxing Albany-mandated state FAR caps, ease parking requirements, and effectively mandate upzoning of transit-adjacent areas; part of the reasoning behind the latter is that communities that benefit most from this state-subsidized service ought to do more to support new residents and retail, a.k.a. tax base, to support said services.
New York Mayor Eric Adams and a large number of community organizations and legislators are behind the proposal. Unsurprisingly, however, the measures are strongly opposed by Not-In-My-Back-Yard types of all varieties, ranging from auto-centric lifestyle supporters to wealthy property owners interested in maintaining high housing prices, to those unacquainted with community-encompassing benefits of zoning change.
Of course, a proper revision of the zoning code is far from a simple task, and in addition to any new housing, will require commesurate improvements to infrastructure, schools, healthcare, public space, and more. Ultimately, however, a much-needed revision to outdated state and local zoning laws will benefit our state’s residents on all levels.
606 West 30th Street. Photo by Michael Young
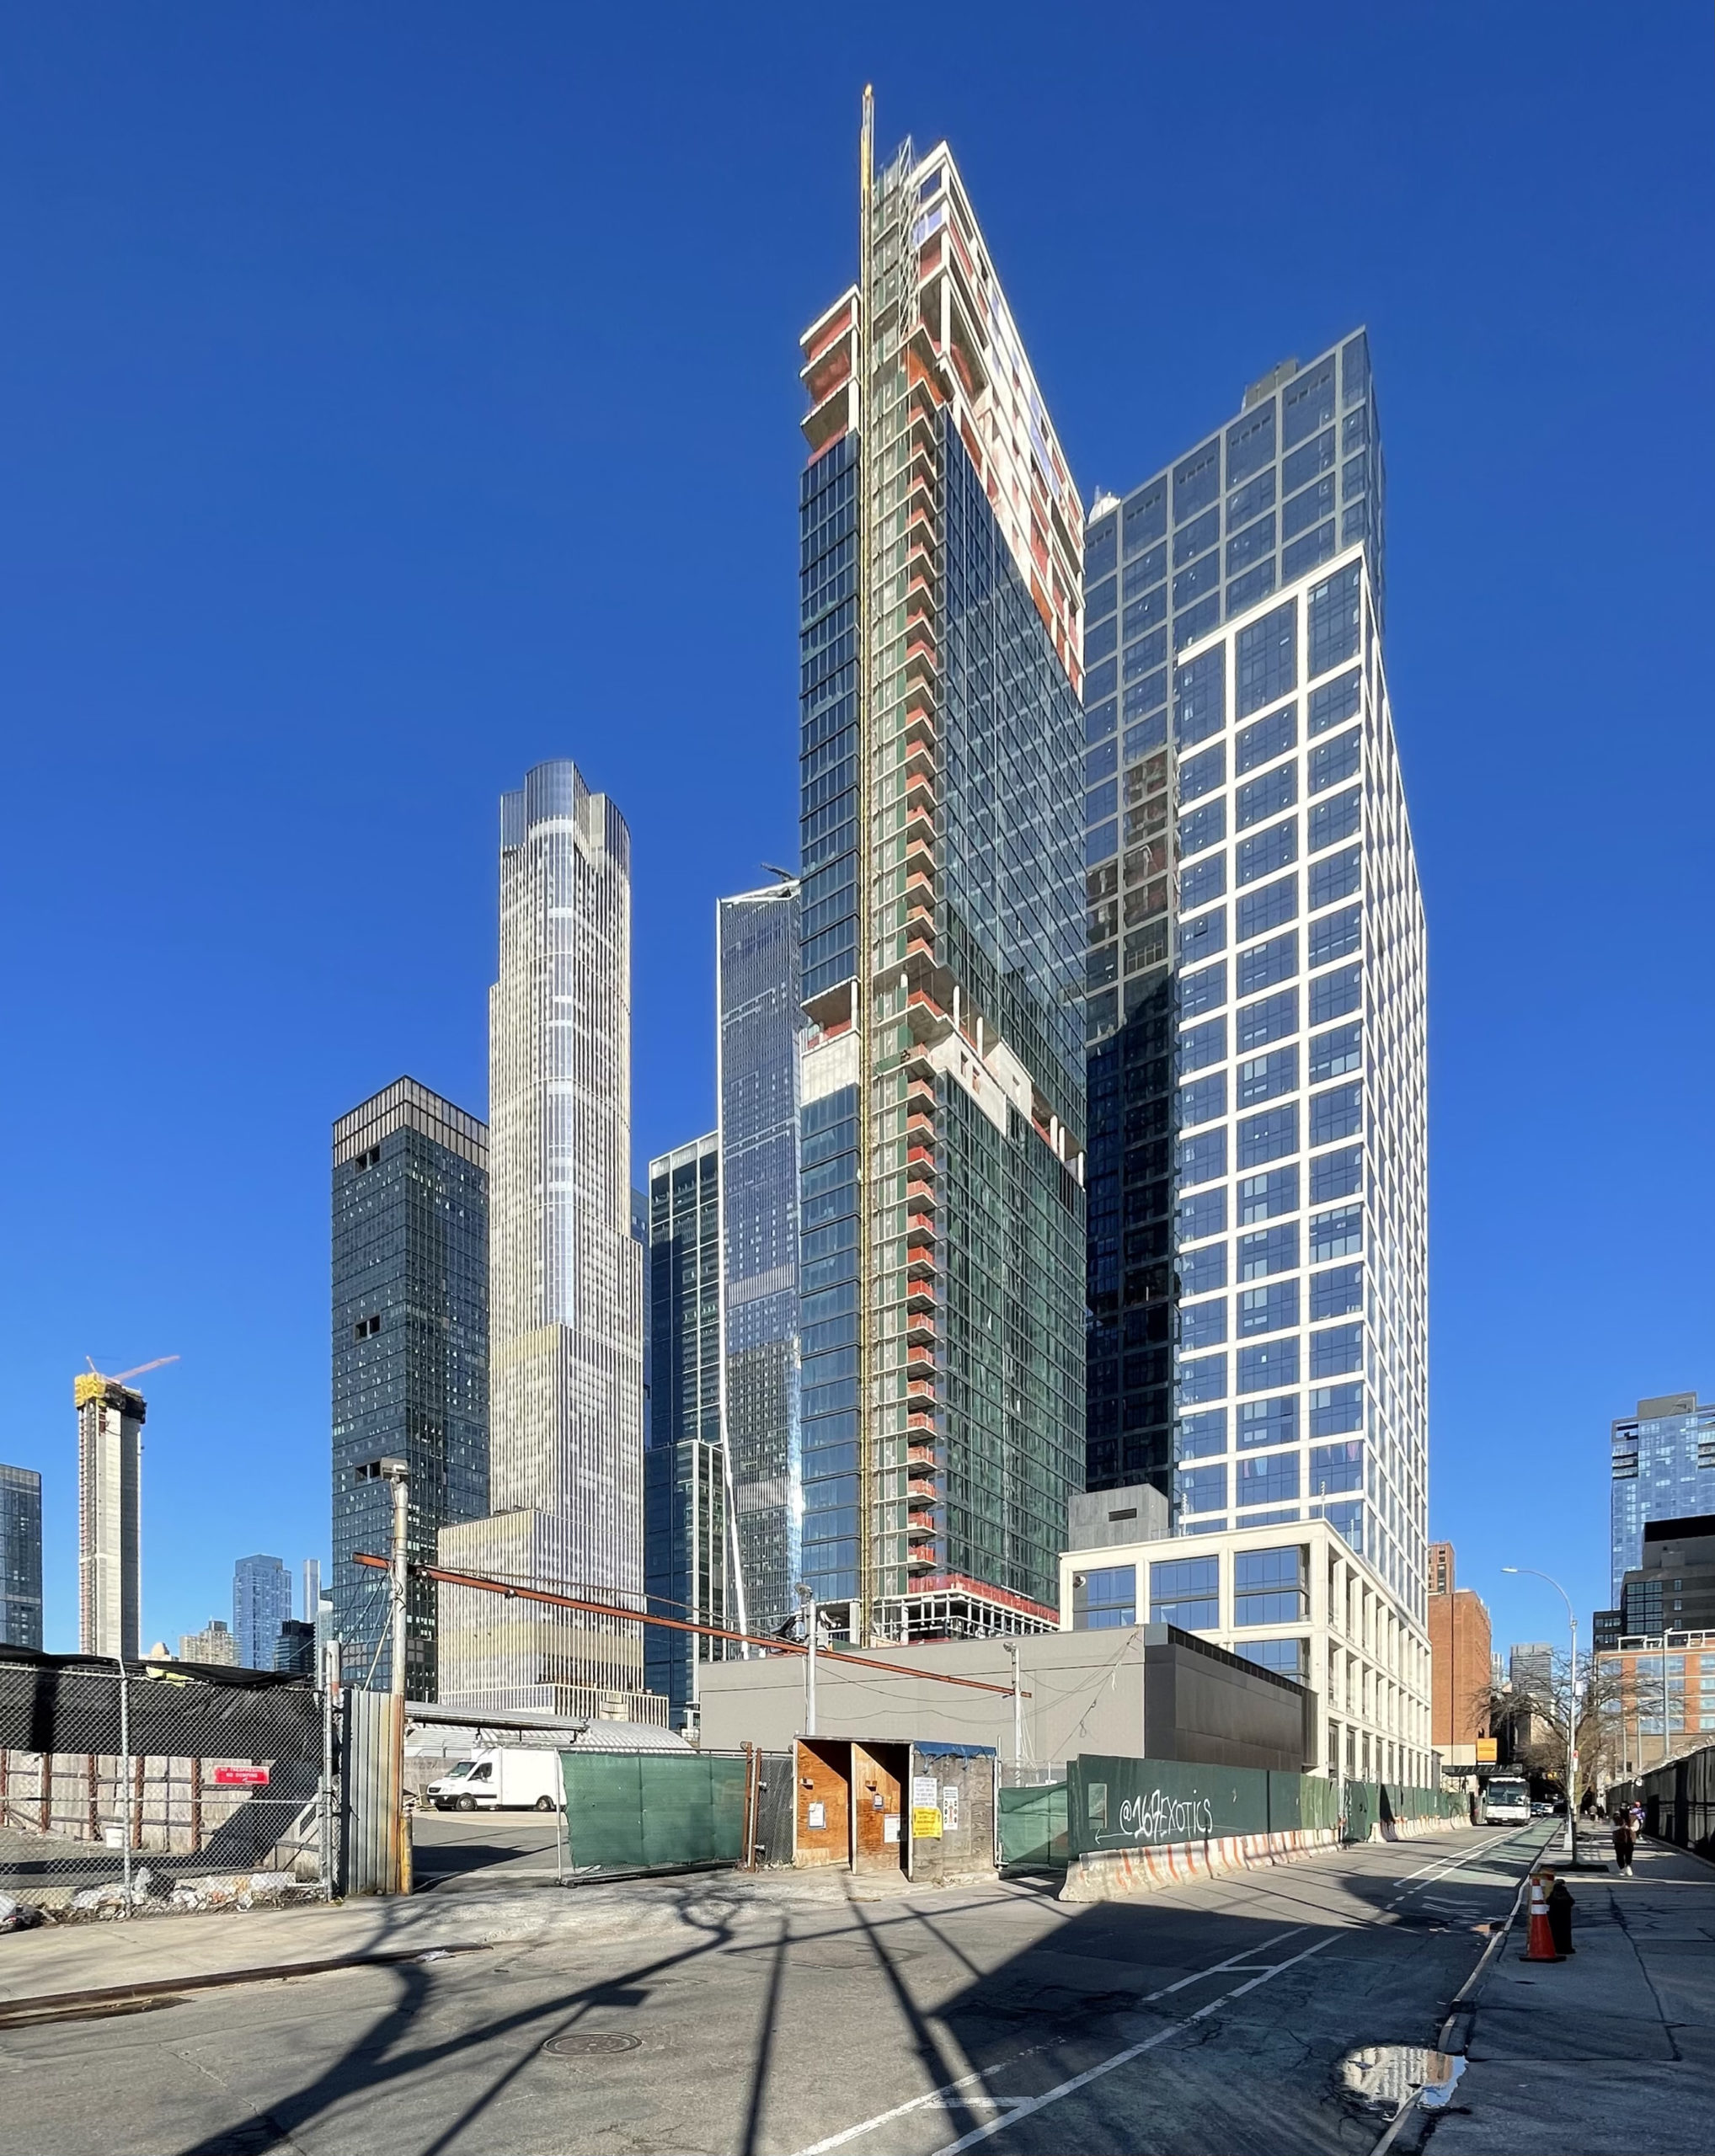
27-01 Jackson Avenue. Photo by Michael Young

Gotham Point. Photo by Michael Young
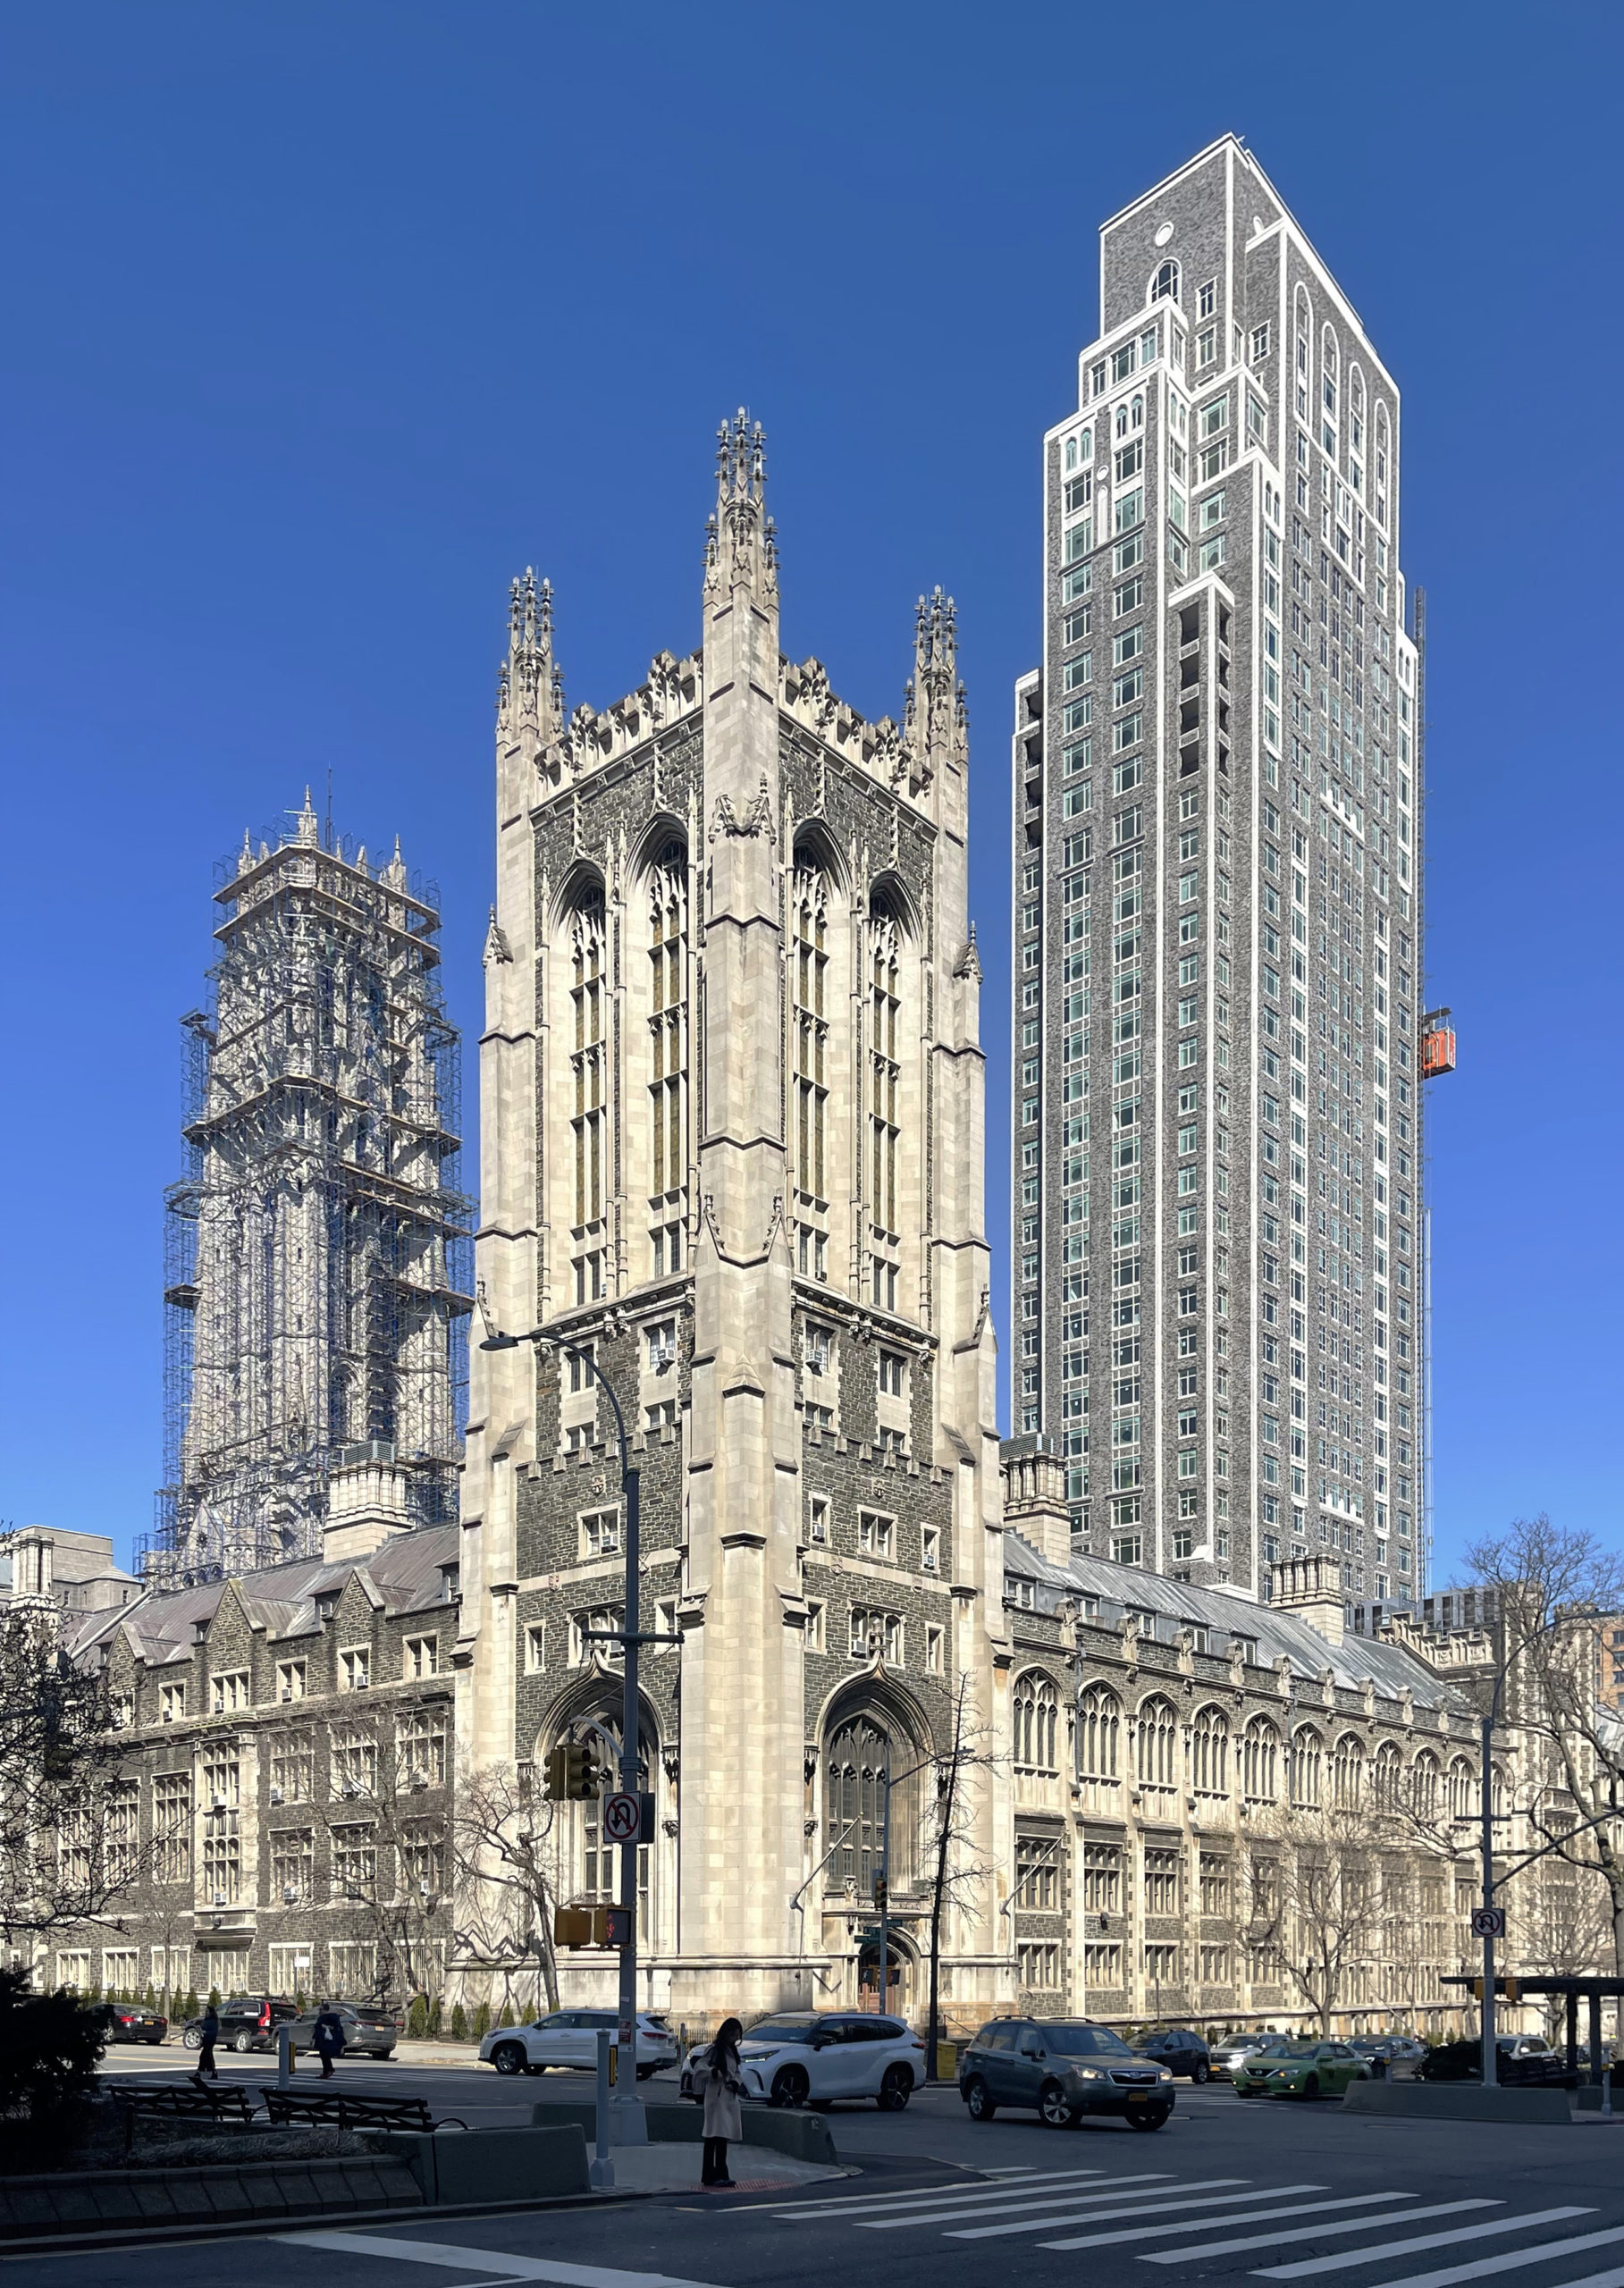
Claremont Hall. Photo by Michael Young

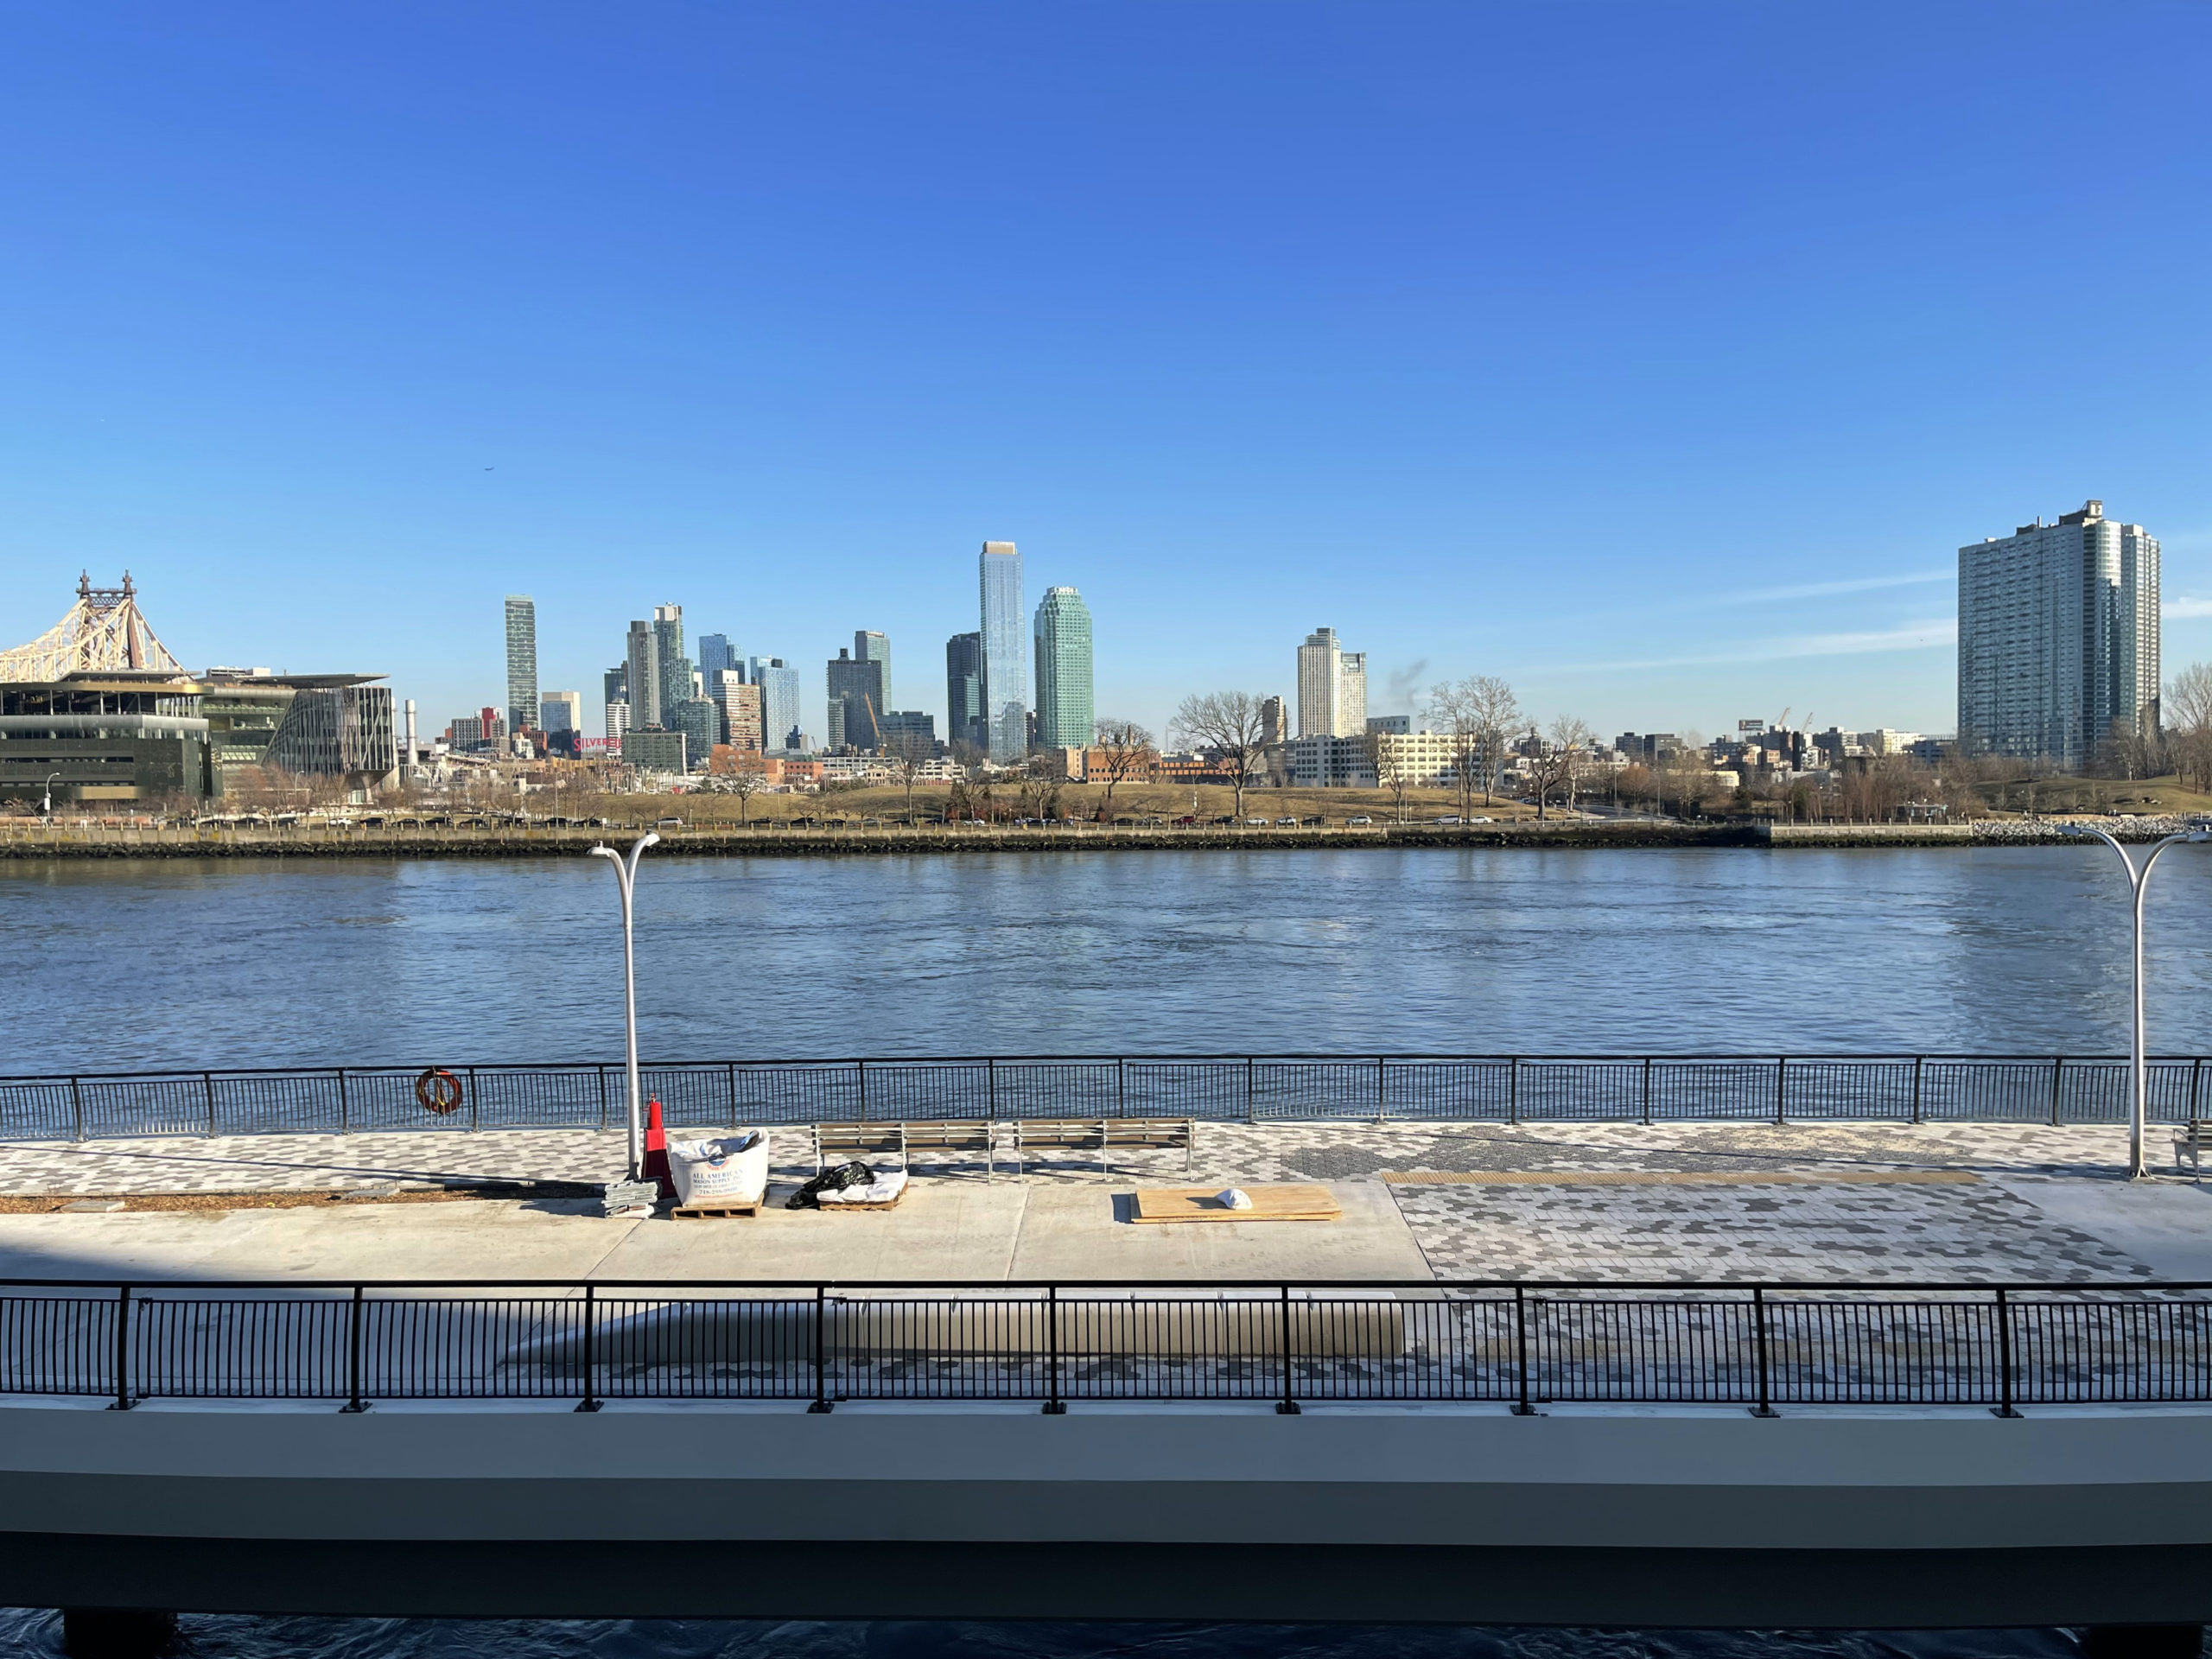
Photo by Michael Young
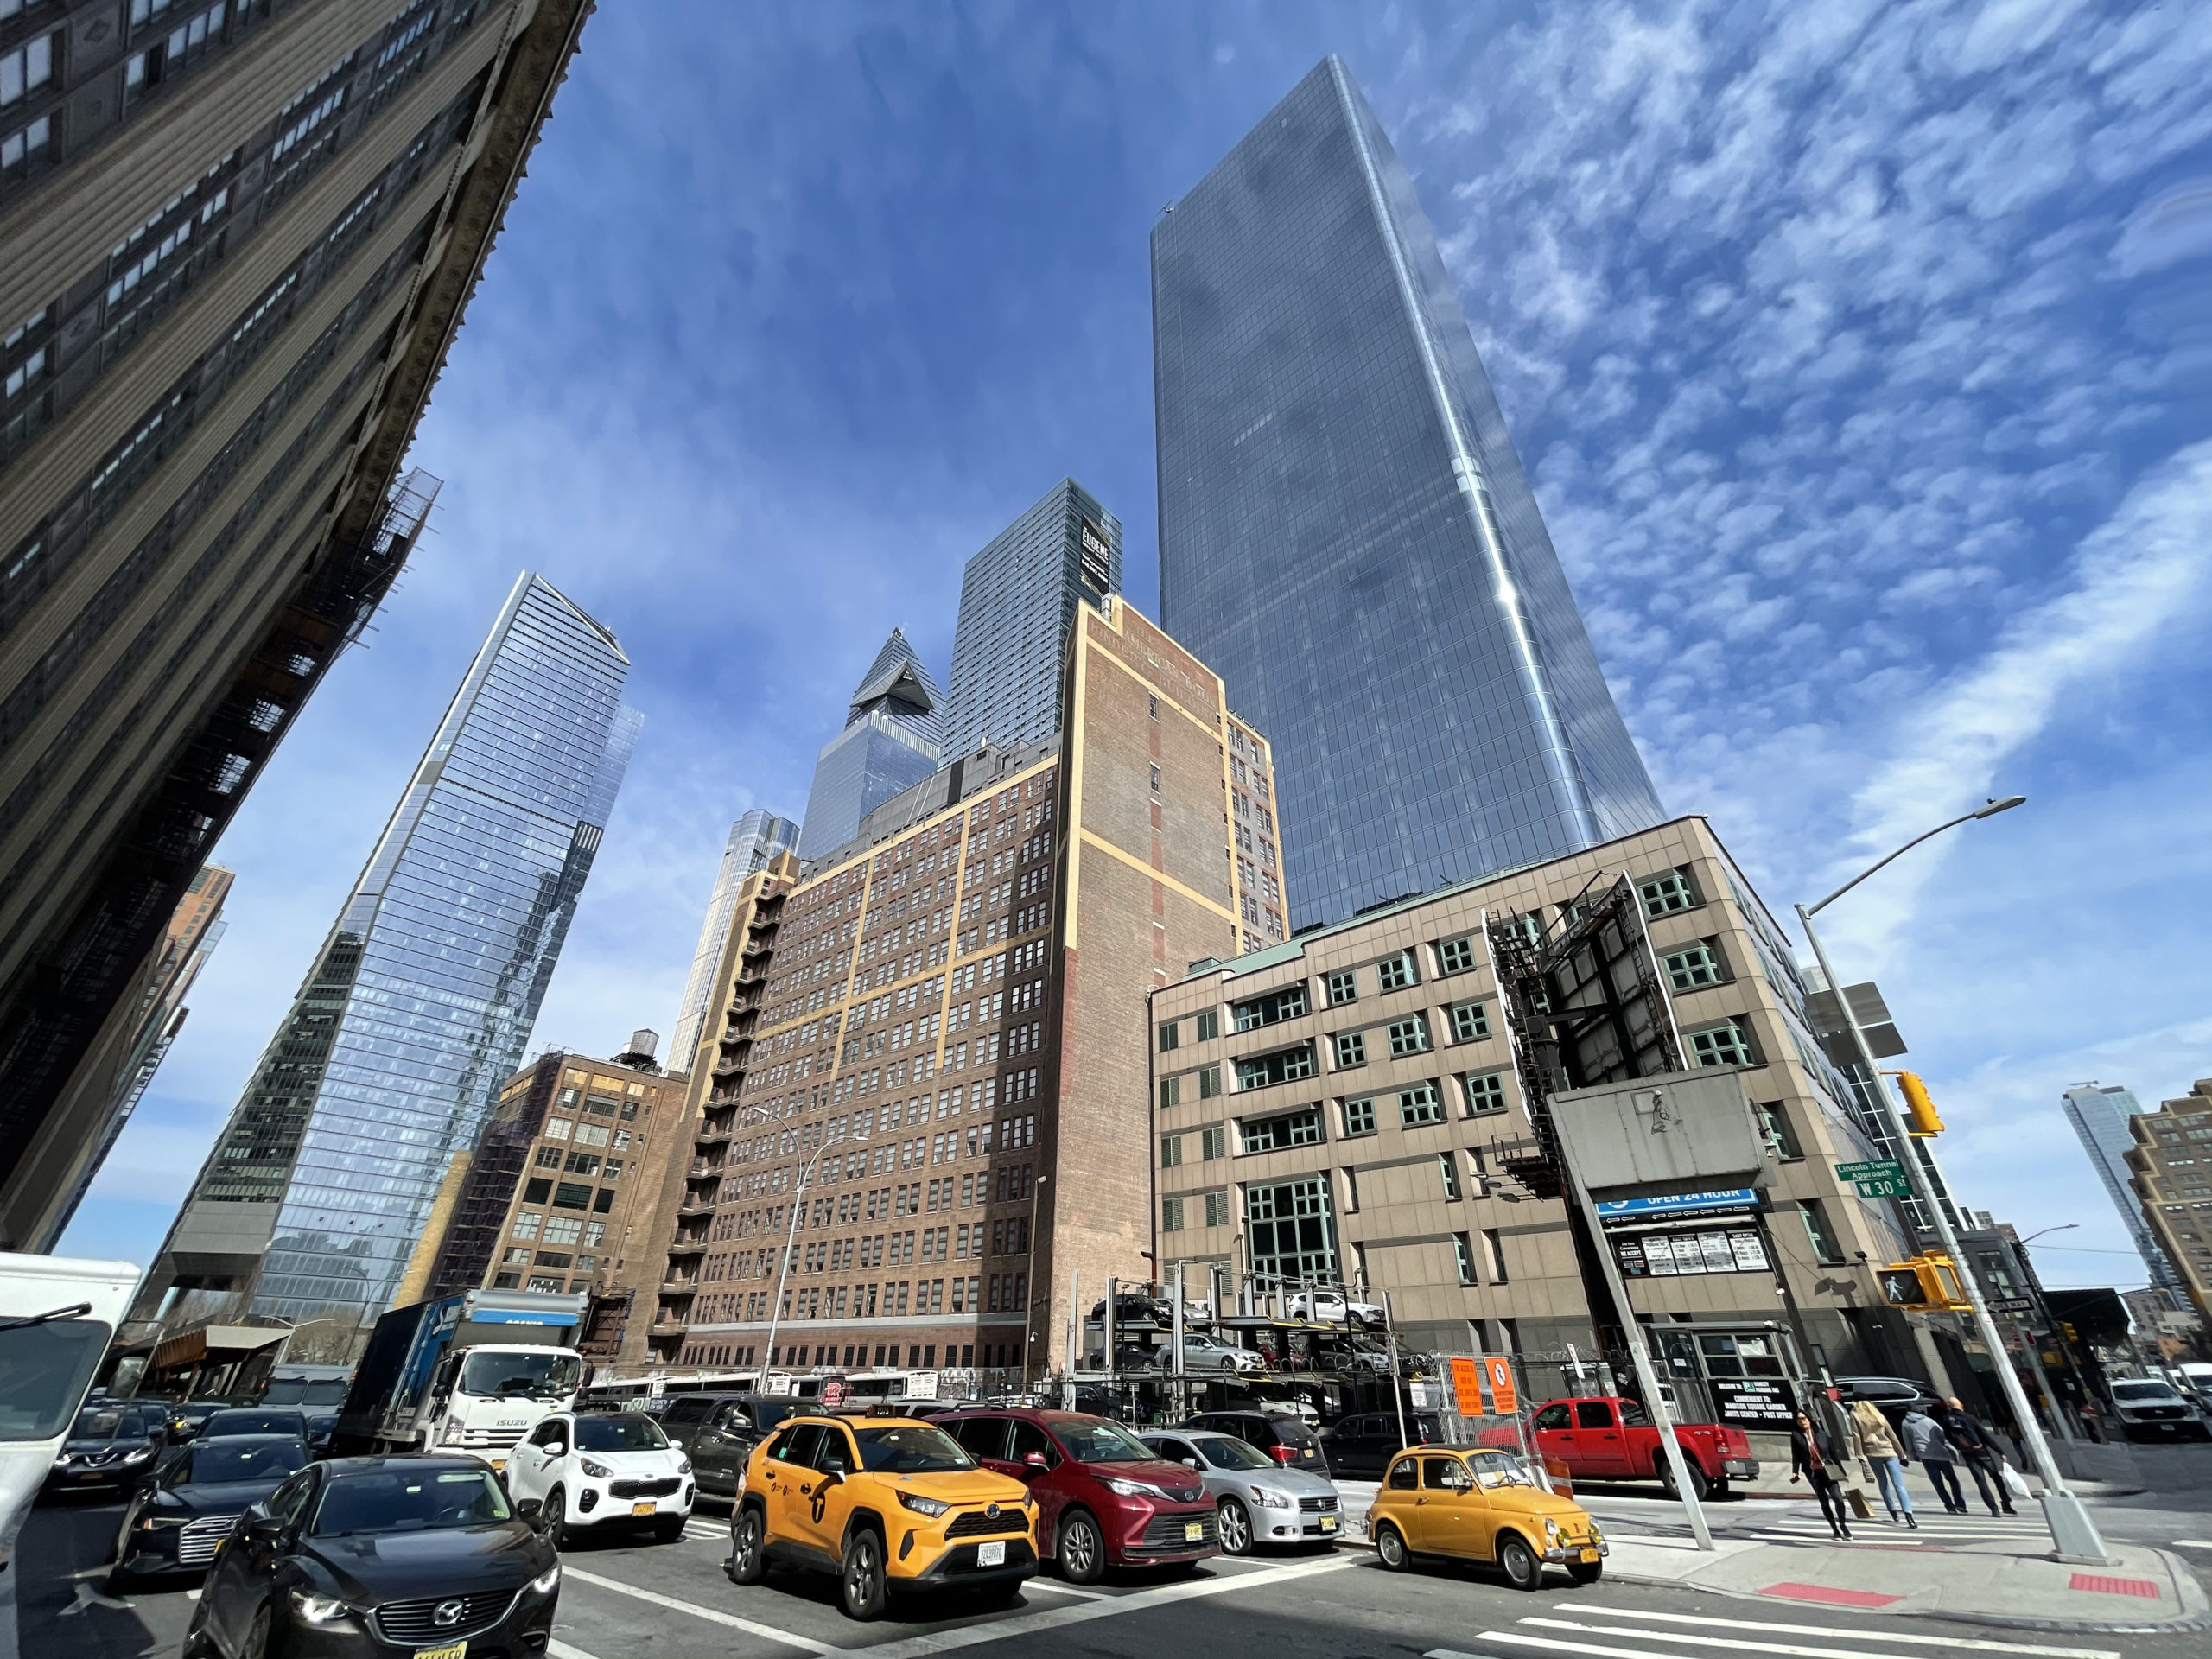
Photo by Michael Young

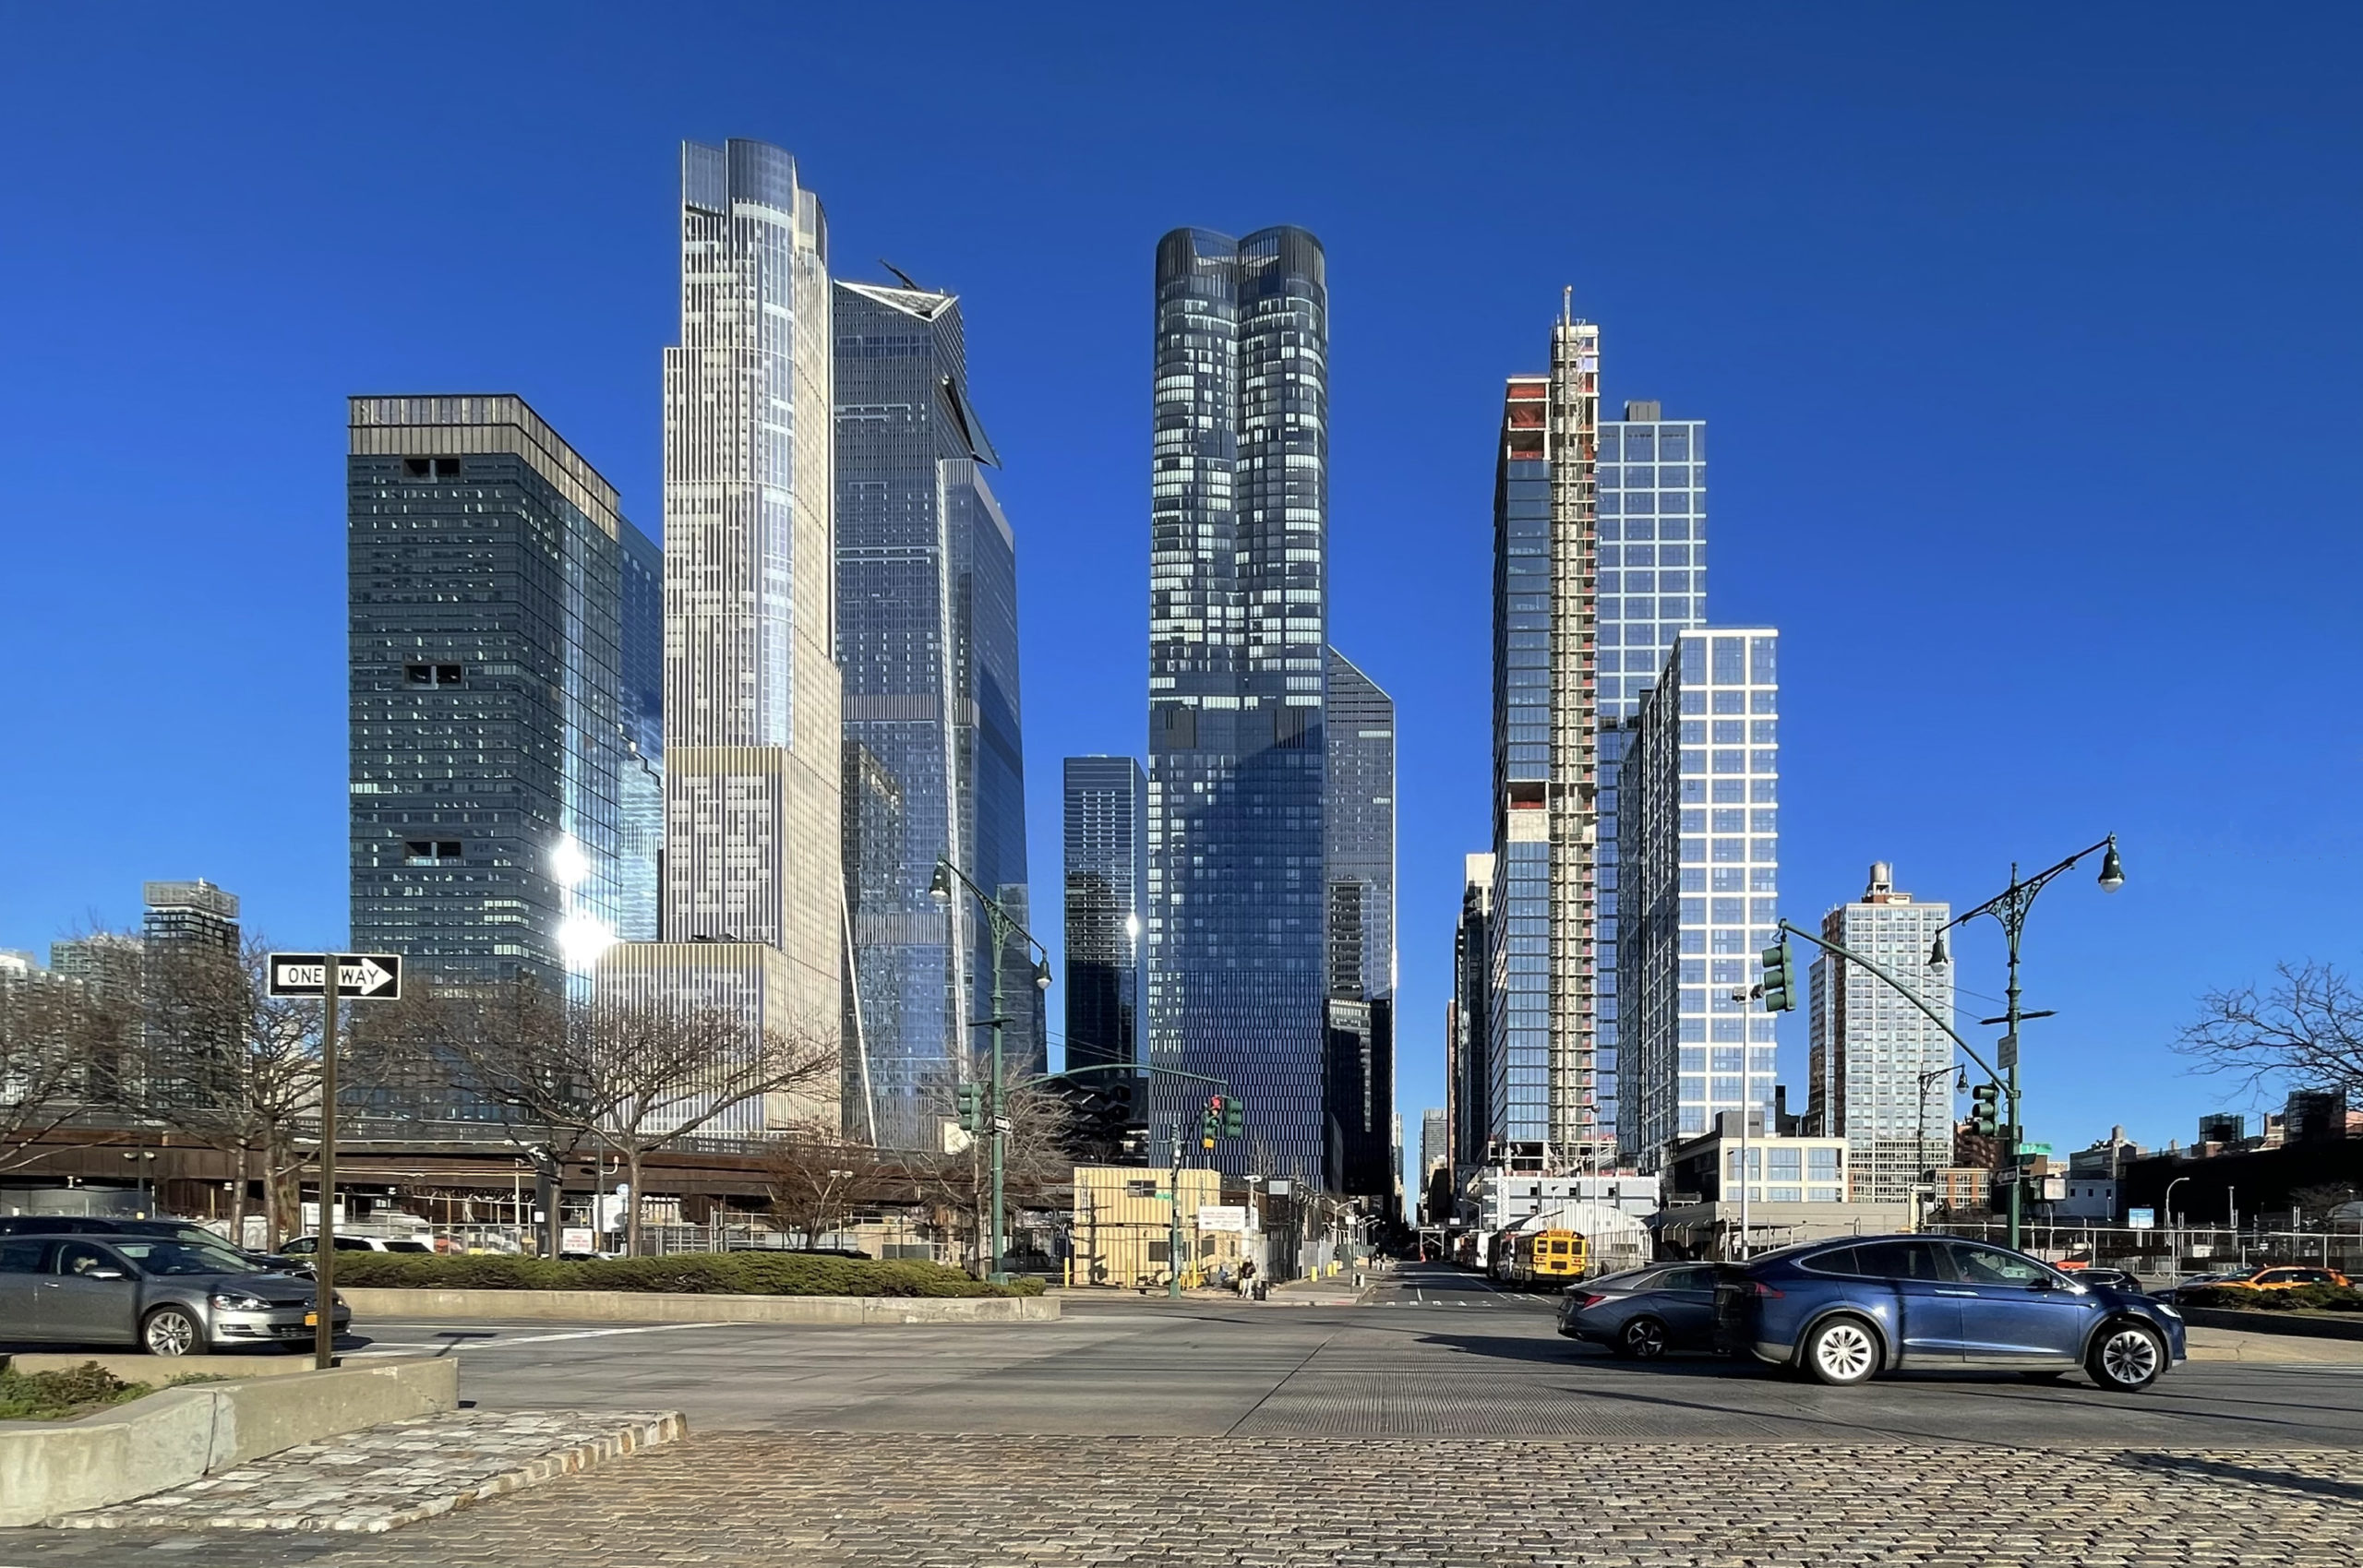
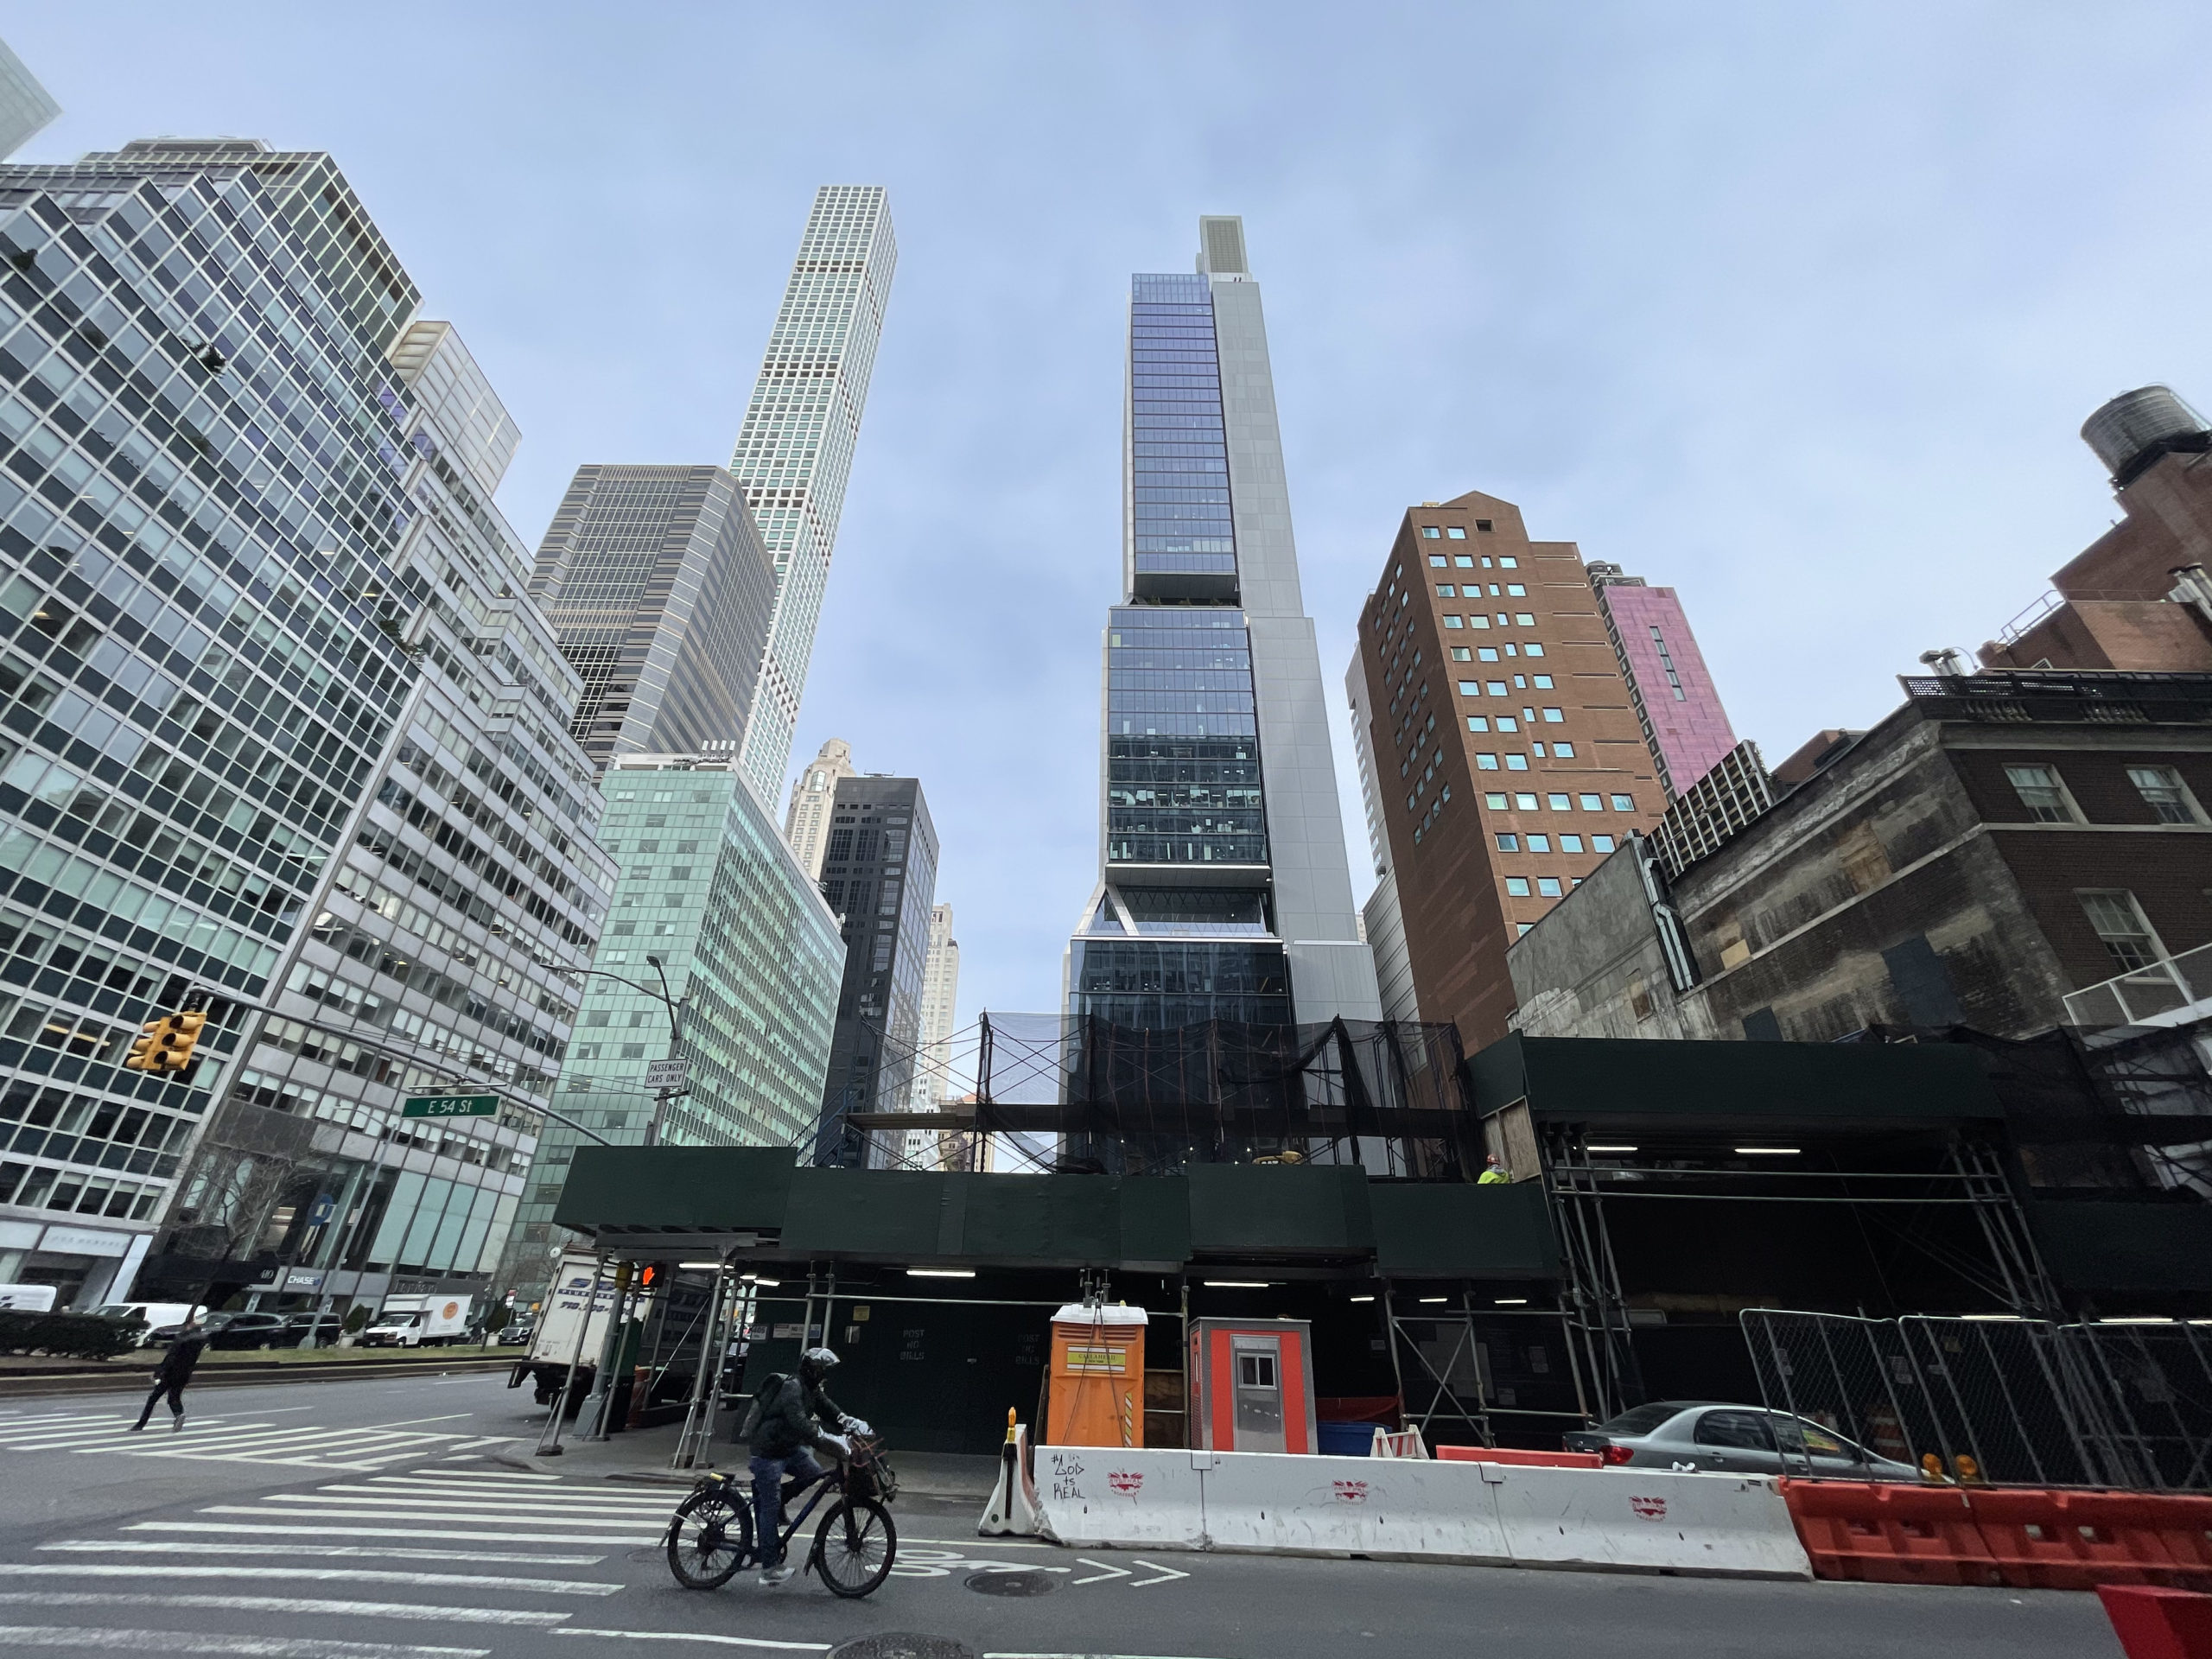
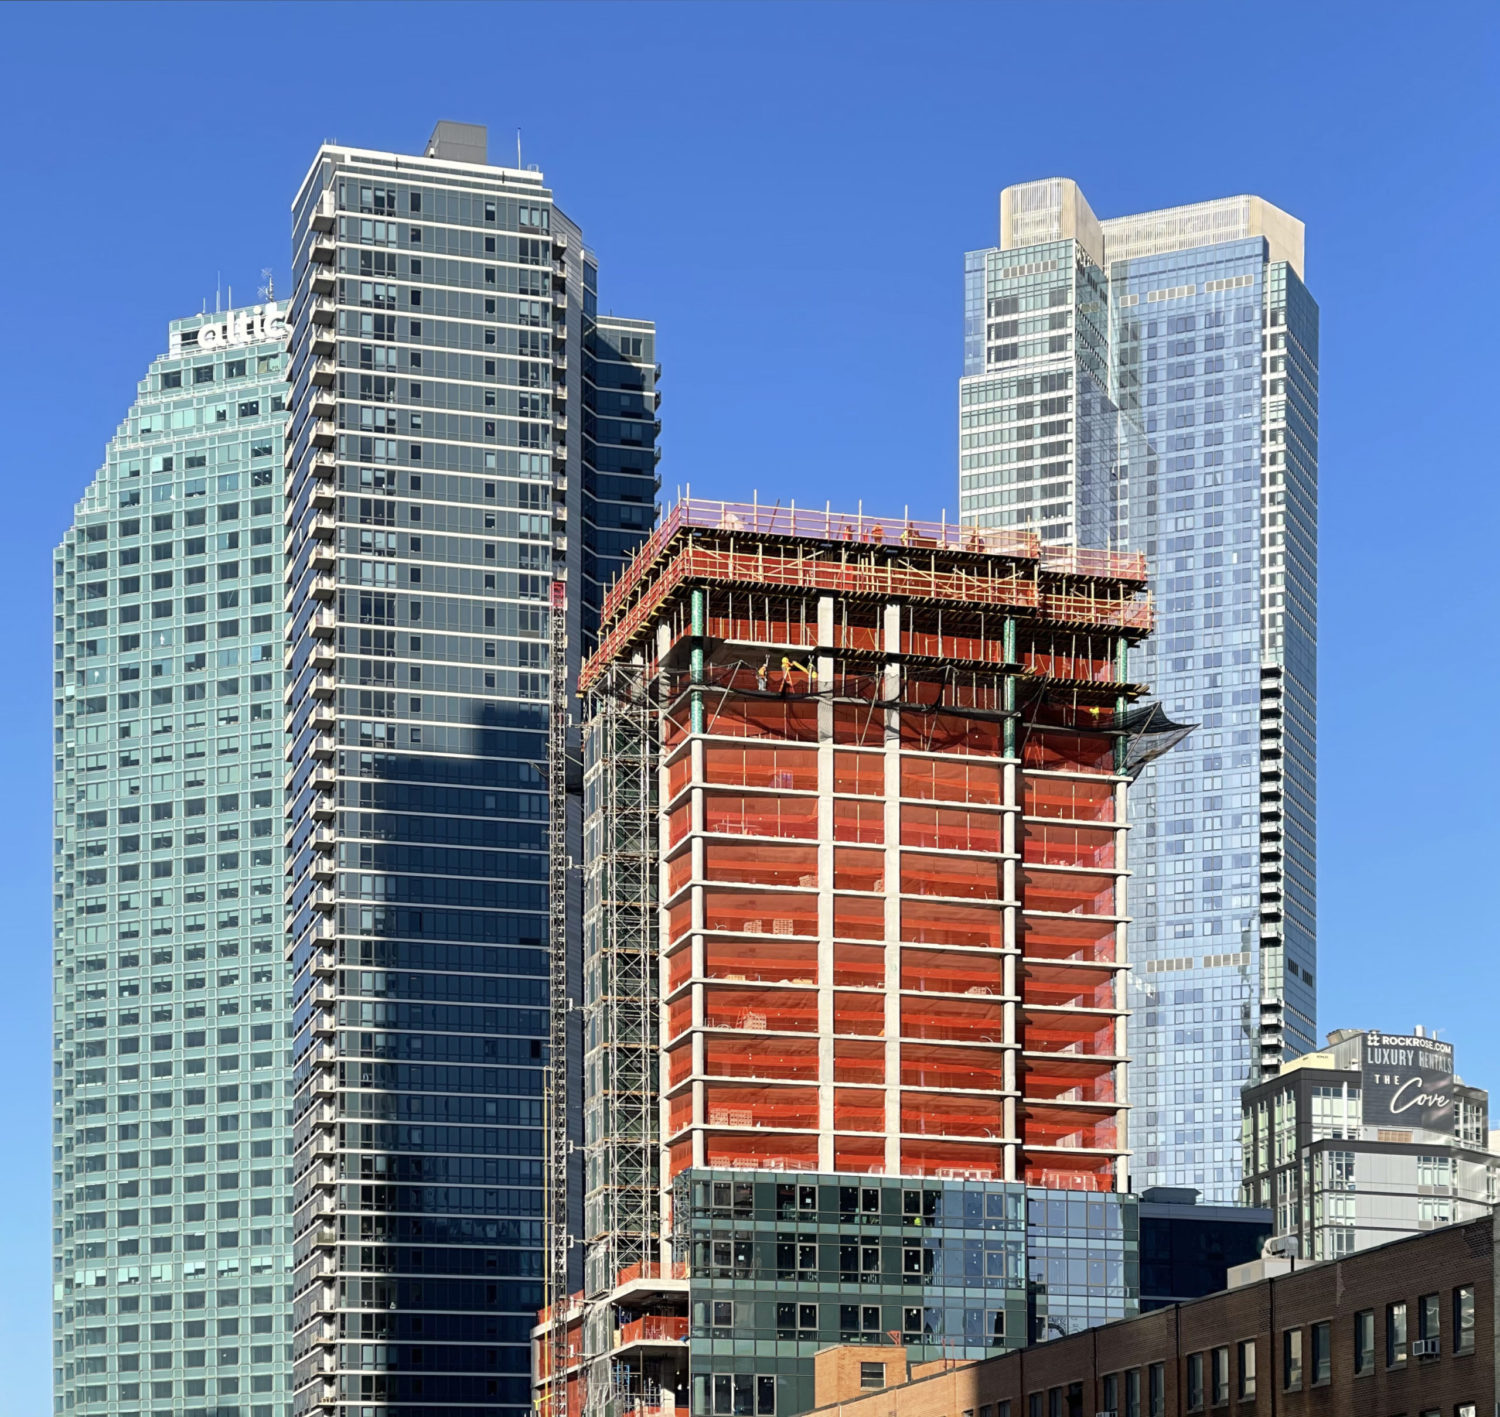
413-421 Ninth Avenue. Photo by Michael Young
665 Fifth Avenue. Photo by Michael Young

Photo by Michael Young